Tracking Car to 500 meters
Summary
The data constitutes two stereo image pairs collected from cameras mounted on a vehicle. There is a target vehicle which is in the field of view of the stereo setup and is approaching the ego vehicle from a far away distance (~0.5 km). Even at the farthest distance, we observe dense depth data on the target vehicle with ~600 valid pixels. This enables the object detection and tracking module to reliably classify it as an object across all frames. The BEV visualization appropriately depicts enhanced pointcloud density at the target locations.
Hammerhead and GridDetect
Dataset Download (.zip) (23.1 GB)
Point Cloud Download (.zip) (5.9 GB)
GroundTruth
GroundTruth Download (.zip) (21.2 GB)
Camera Specifications
| Horizontal Field of View | 30 degrees |
|---|---|
| Baseline | 1.14 meters |
| Resolution | 5.4 MP |
| Bit depth | 16 bit |
| Frame rate | 5 FPS |
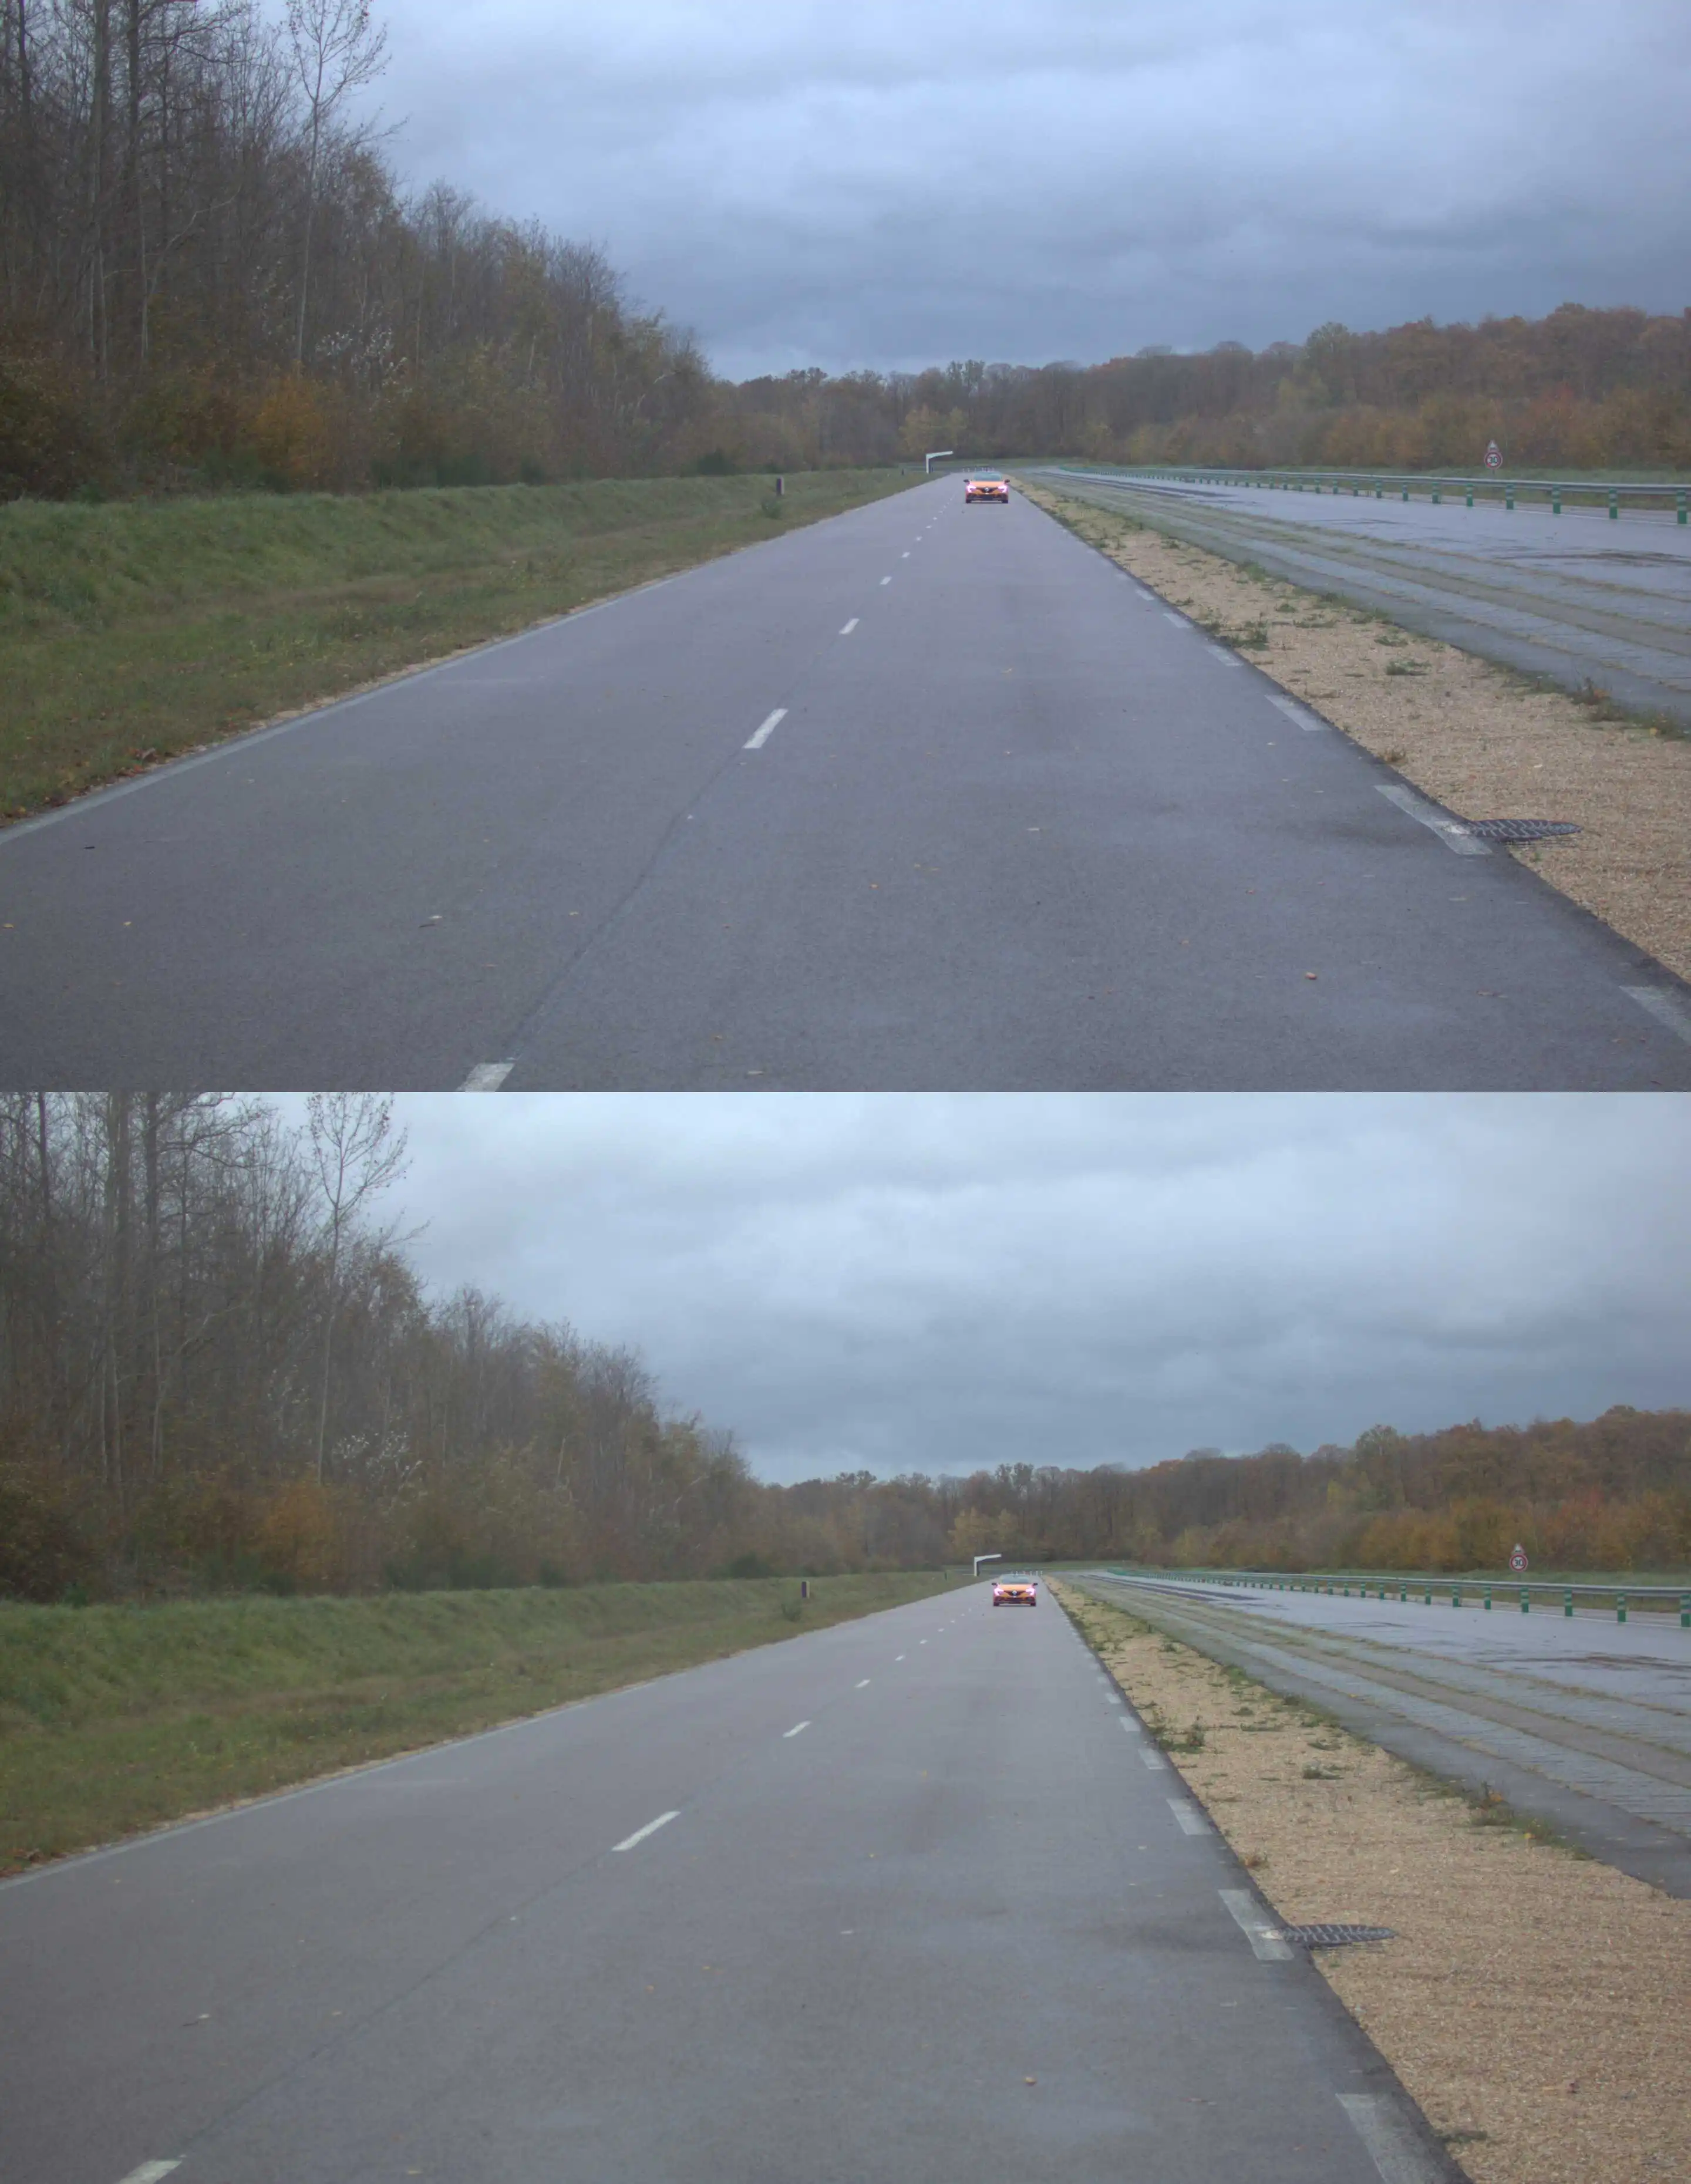
Topbot Images
These are vertically concatenated raw images from the left and right camera as shown below:
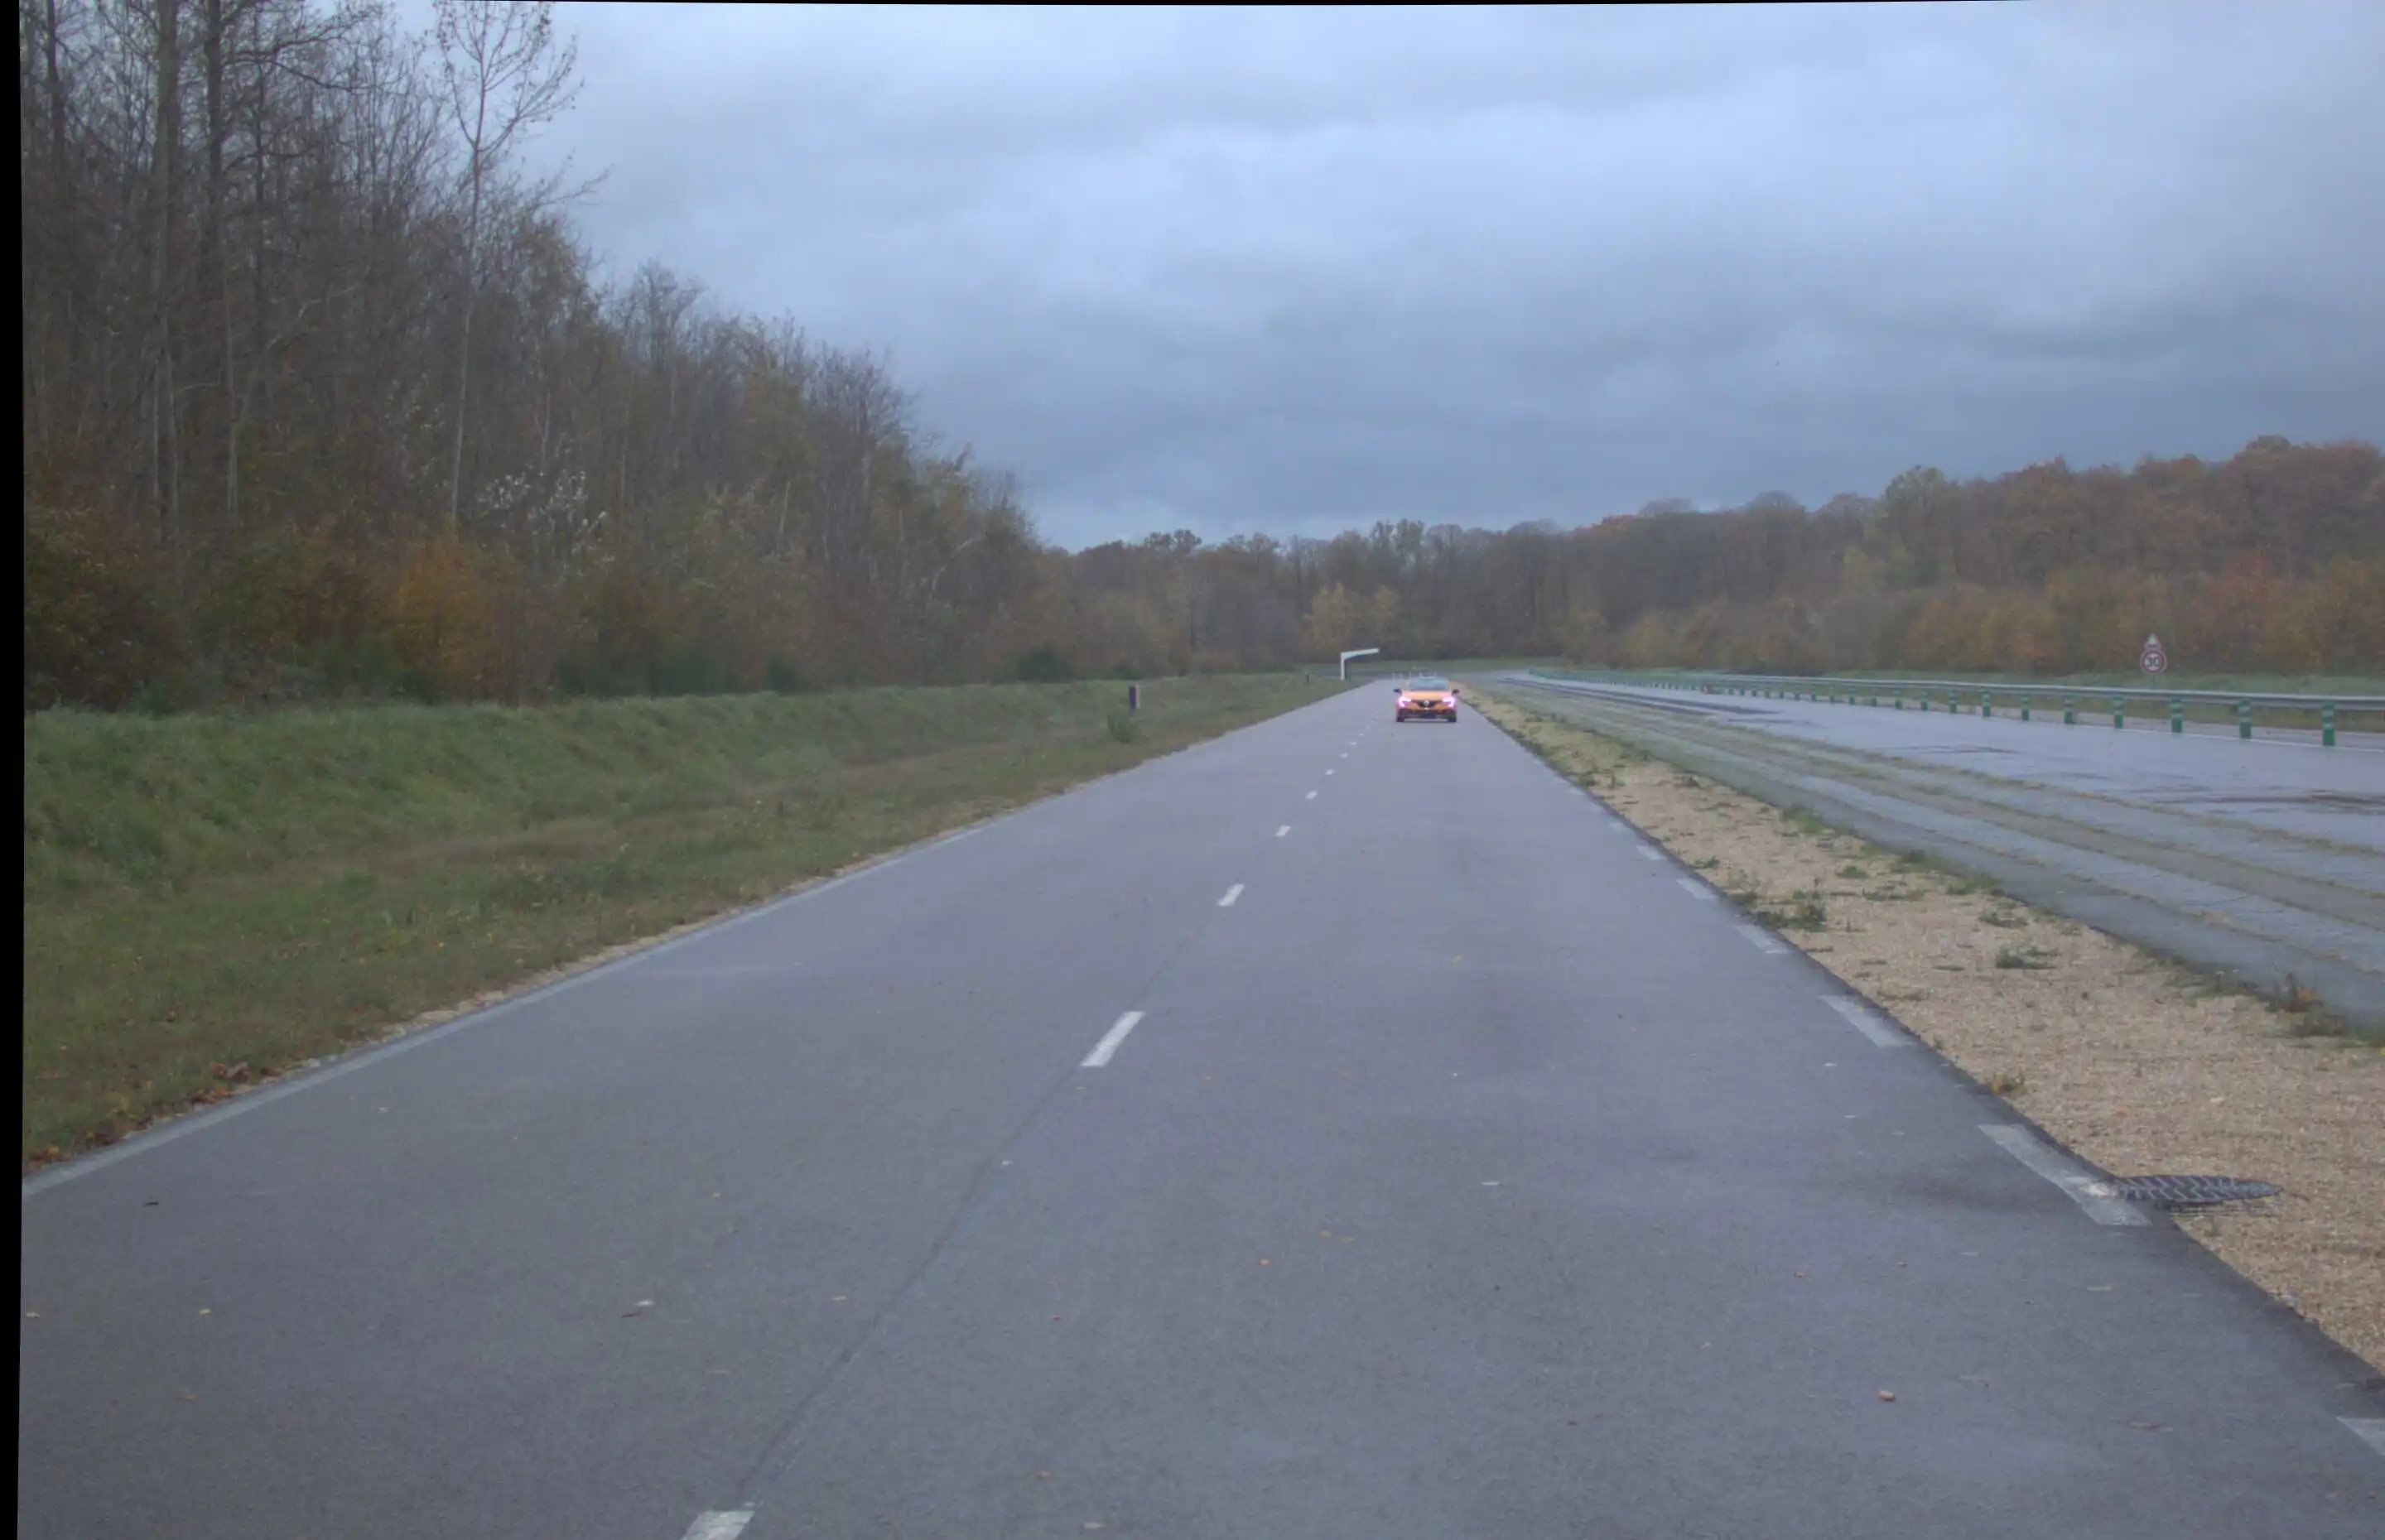
Left-rectified Images
The left-rectified image shows the image from the left camera after rectification, as shown below:
Hammerhead and GridDetect Performance
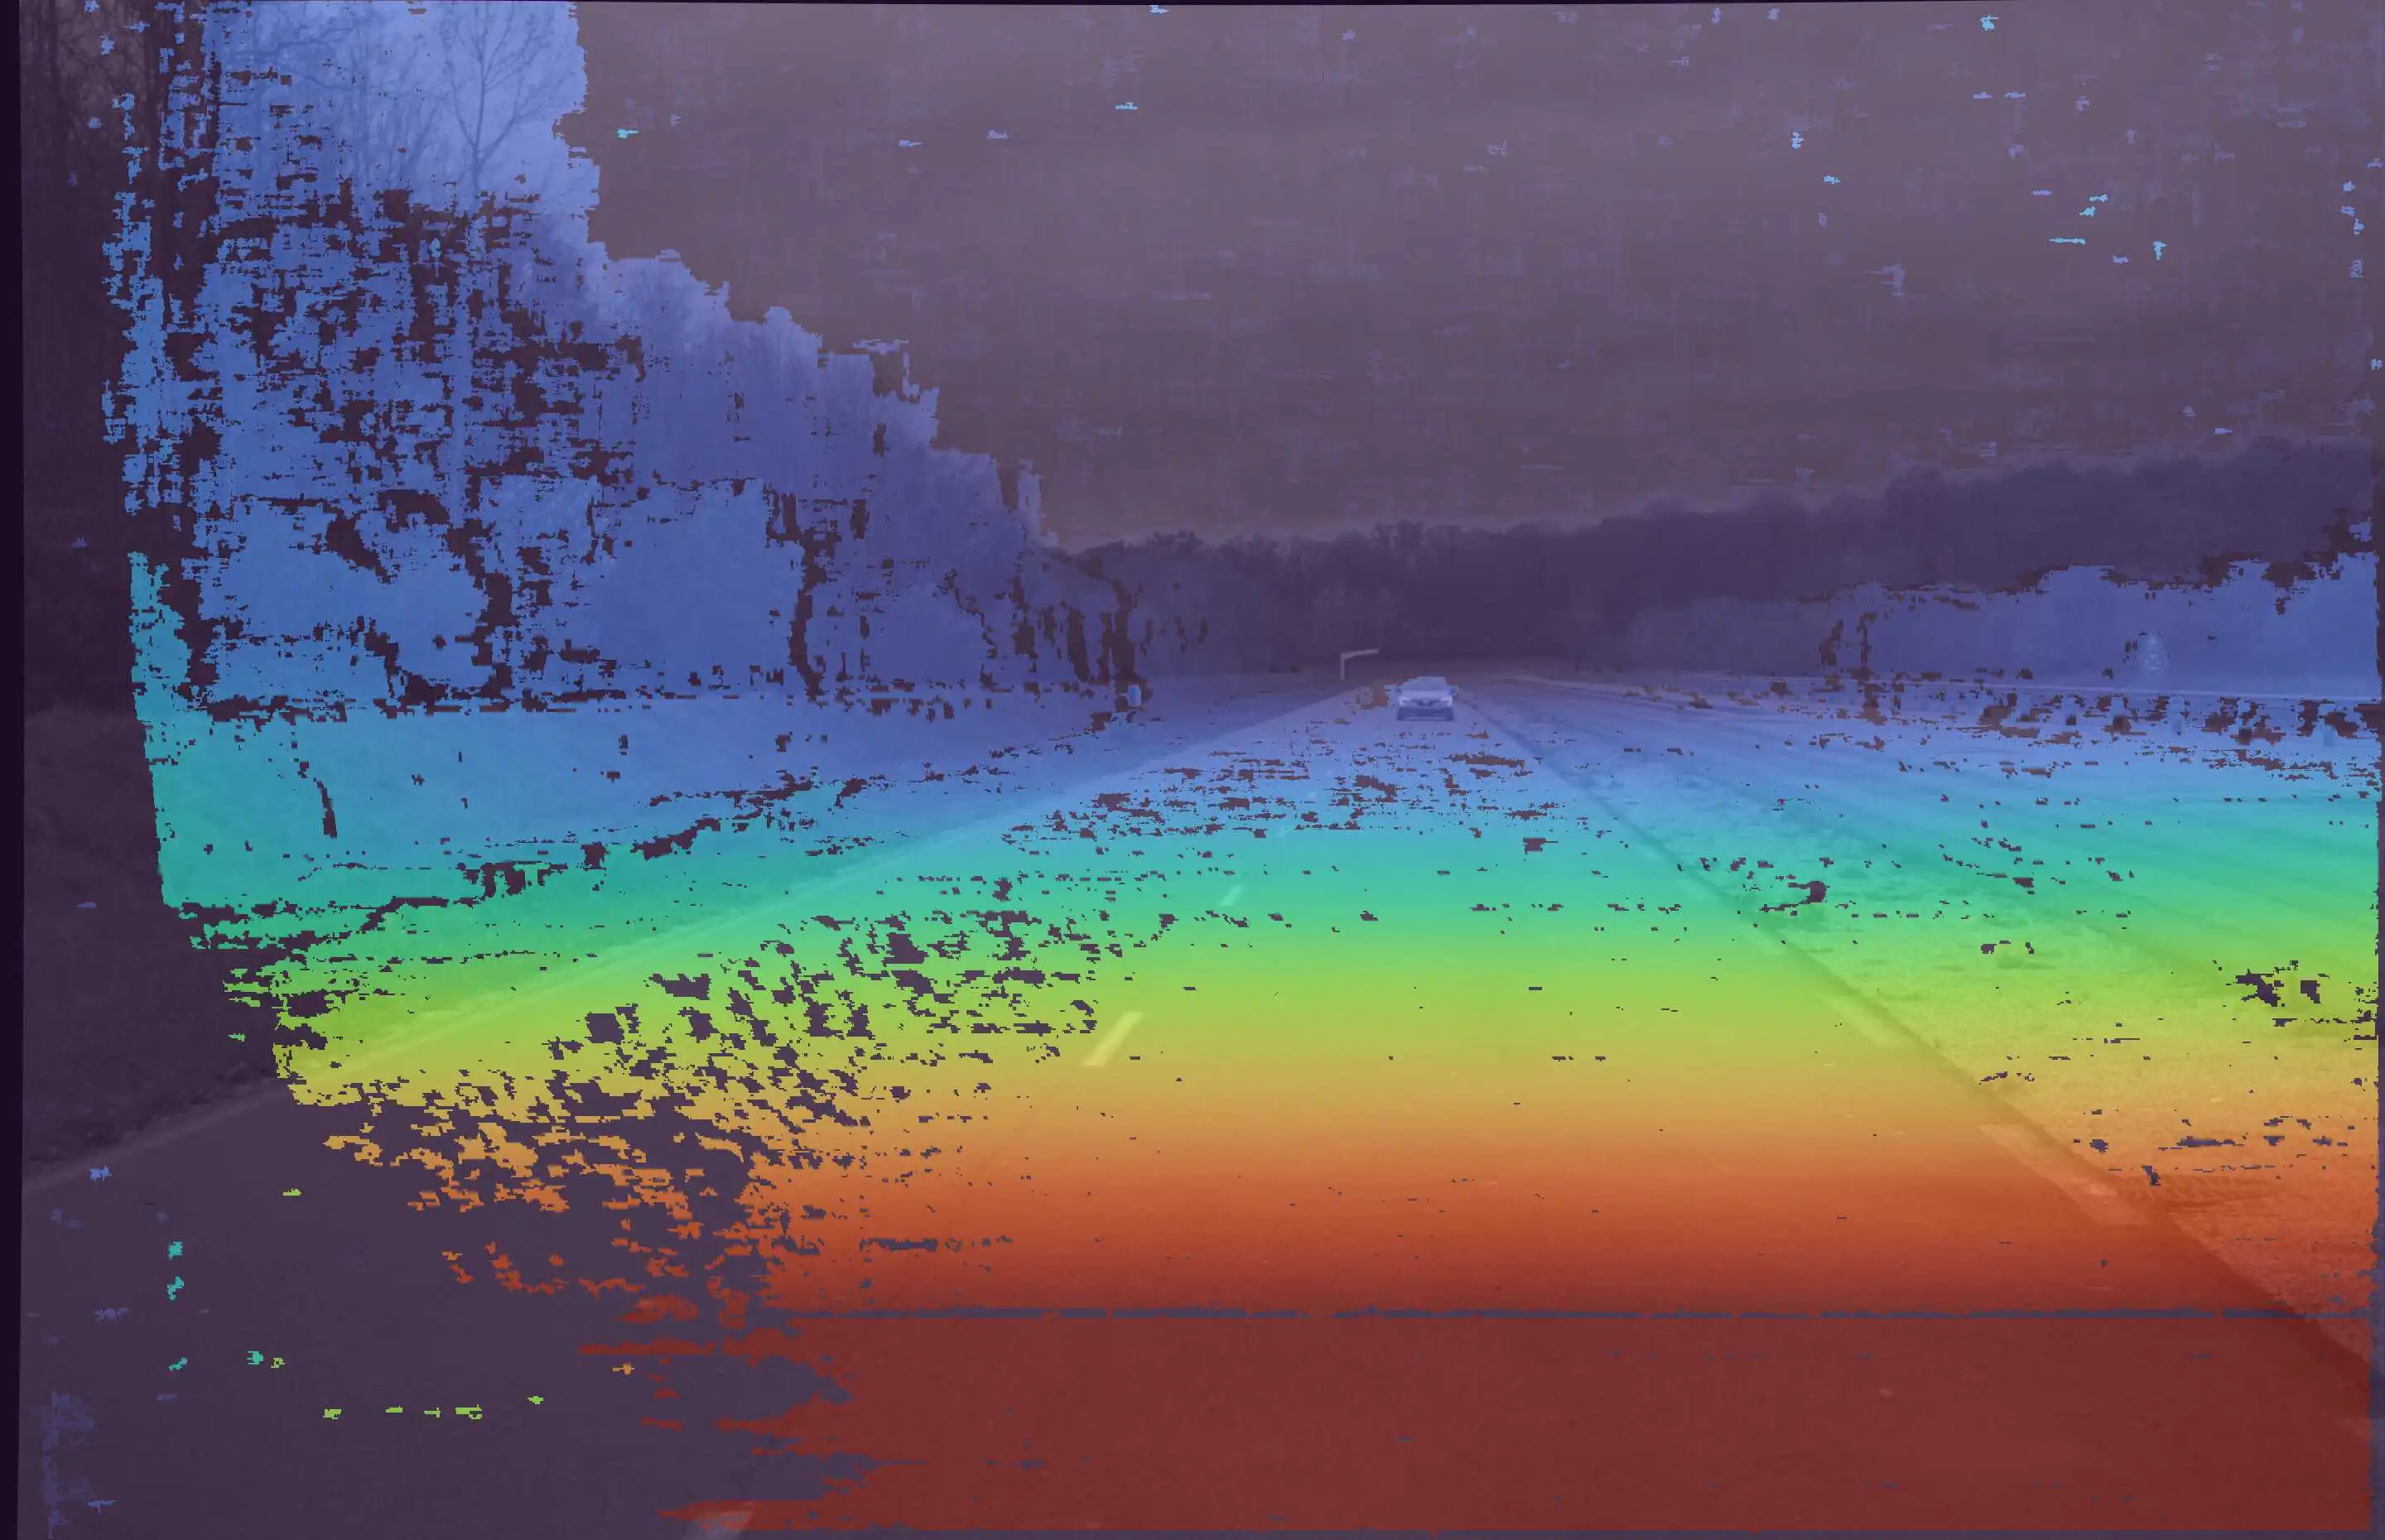
Depth Map
The depth map is an image, where each pixel corresponds its depth information in meters. It can be better visualized in the colored depth maps, with blended RGB channel shown below:
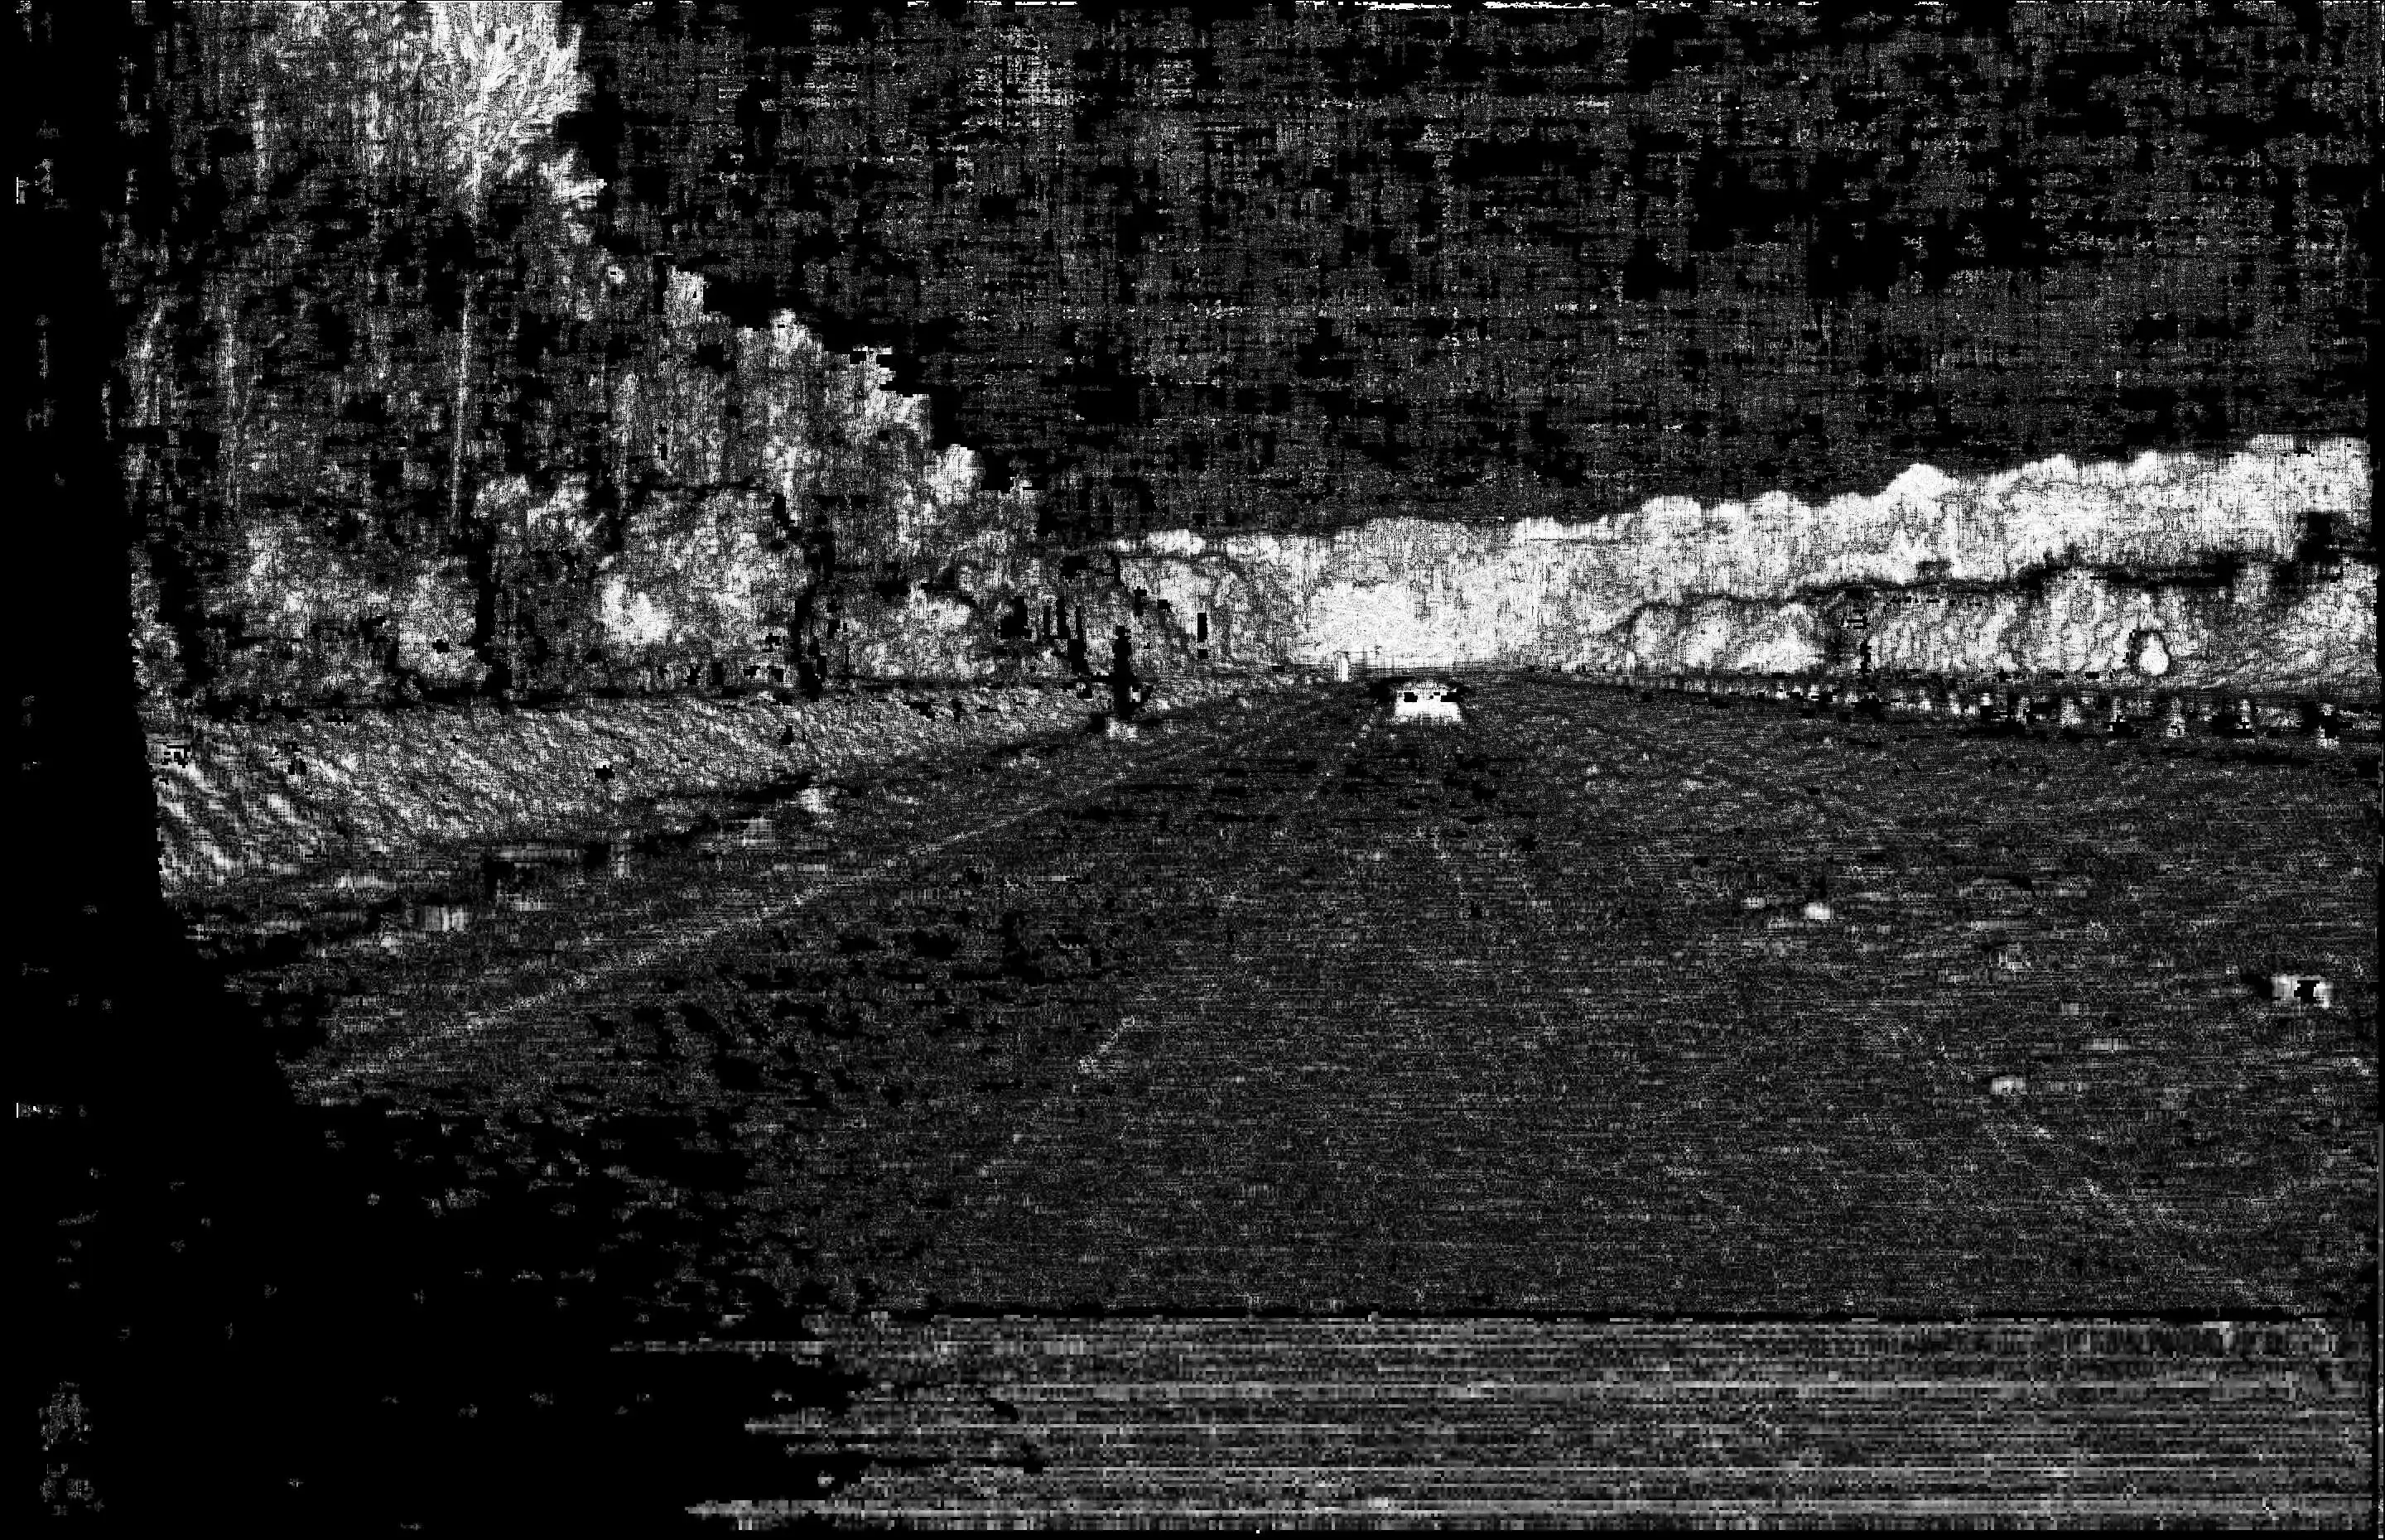
Confidence Map
The confidence map stores the confidence in the depth information produced by our stereo-matching algorithm, as shown below:
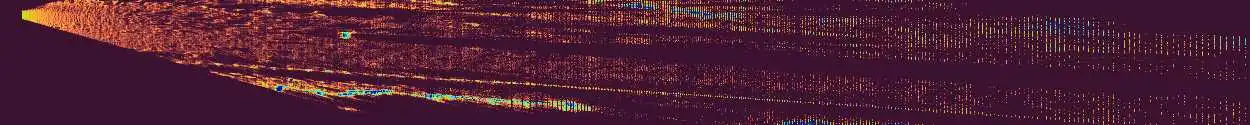
BEV Visualization
The Bird's Eye View (BEV) is a discrete representation of the point cloud looking from a top view. Each grid cell is 0.4m-by-0.4m, and the color of a grid cell in BEV encodes the density of points it accommodates. Consequently, objects on the road appear brighter in BEV. The forward direction (z-axis) is encoded along the horizontal dimension and captures up to a range of 500 m, while the lateral direction (x-axis) is encoded in the vertical dimension of BEV.
Object Detection
Our detection module compresses the dense pointcloud data into succinct bounding boxes around objects, in BEV. It also accounts for temporal correlations, enabling it to assess relative velocity of the objects in the X-Z plane. The output is a .csv file and each row stores the locations of the 3 consecutive corners of the bounding box (x1, z1, …) in meters, and relative velocity along x and z directions (vx, vz) in m/s. The bounding boxes can be visualized through our viewer by checking the box "Display Boxes" in the "Point Cloud" window.
Dynamic Occupancy Map
The dynamic occupancy map visualizes the occupancy of each cell in BEV, along with relative velocity direction wrt the ego vehicle. The velocity direction can be inferred based on the color wheel, e.g. motion towards the ego vehicle is yellow, while motion away from it is depicted in blue color. Grey color denotes stationary targets wrt the ego vehicle.