Industrial Dock
Summary
The data has been recorded at an industrial facility, with wide variety of objects in the field of view including heavy machinery, vehicles, workers, storage containers, buildings, and pipes. Time-synchronized stereo image pairs is recorded at 2 FPS from a vehicle mounted setup. The scene aptly depicts a cluttered environment where network-based classification approaches tend to degrade due to the presence of out-of-class objects. On the other hand, traditional lidar suffers from low point density on distant targets, which is crucial for accurate 3D perception of the environment. The depth map depicts high resolution even on low aspect ratio targets which are often overlooked when using other sensing modalities, while preserve crisp object edges.
Hammerhead and GridDetect
Dataset Download (.zip) (4.4 GB)
Point Cloud Download (.zip) (3.0 GB)
GroundTruth
GroundTruth Download (.zip) (3.3 GB)
Camera Specifications
| Horizontal Field of View | 30 degrees |
|---|---|
| Baseline | 1.14 meters |
| Resolution | 5.4 MP |
| Bit depth | 8 bit |
| Frame rate | 2 FPS |
Topbot Images
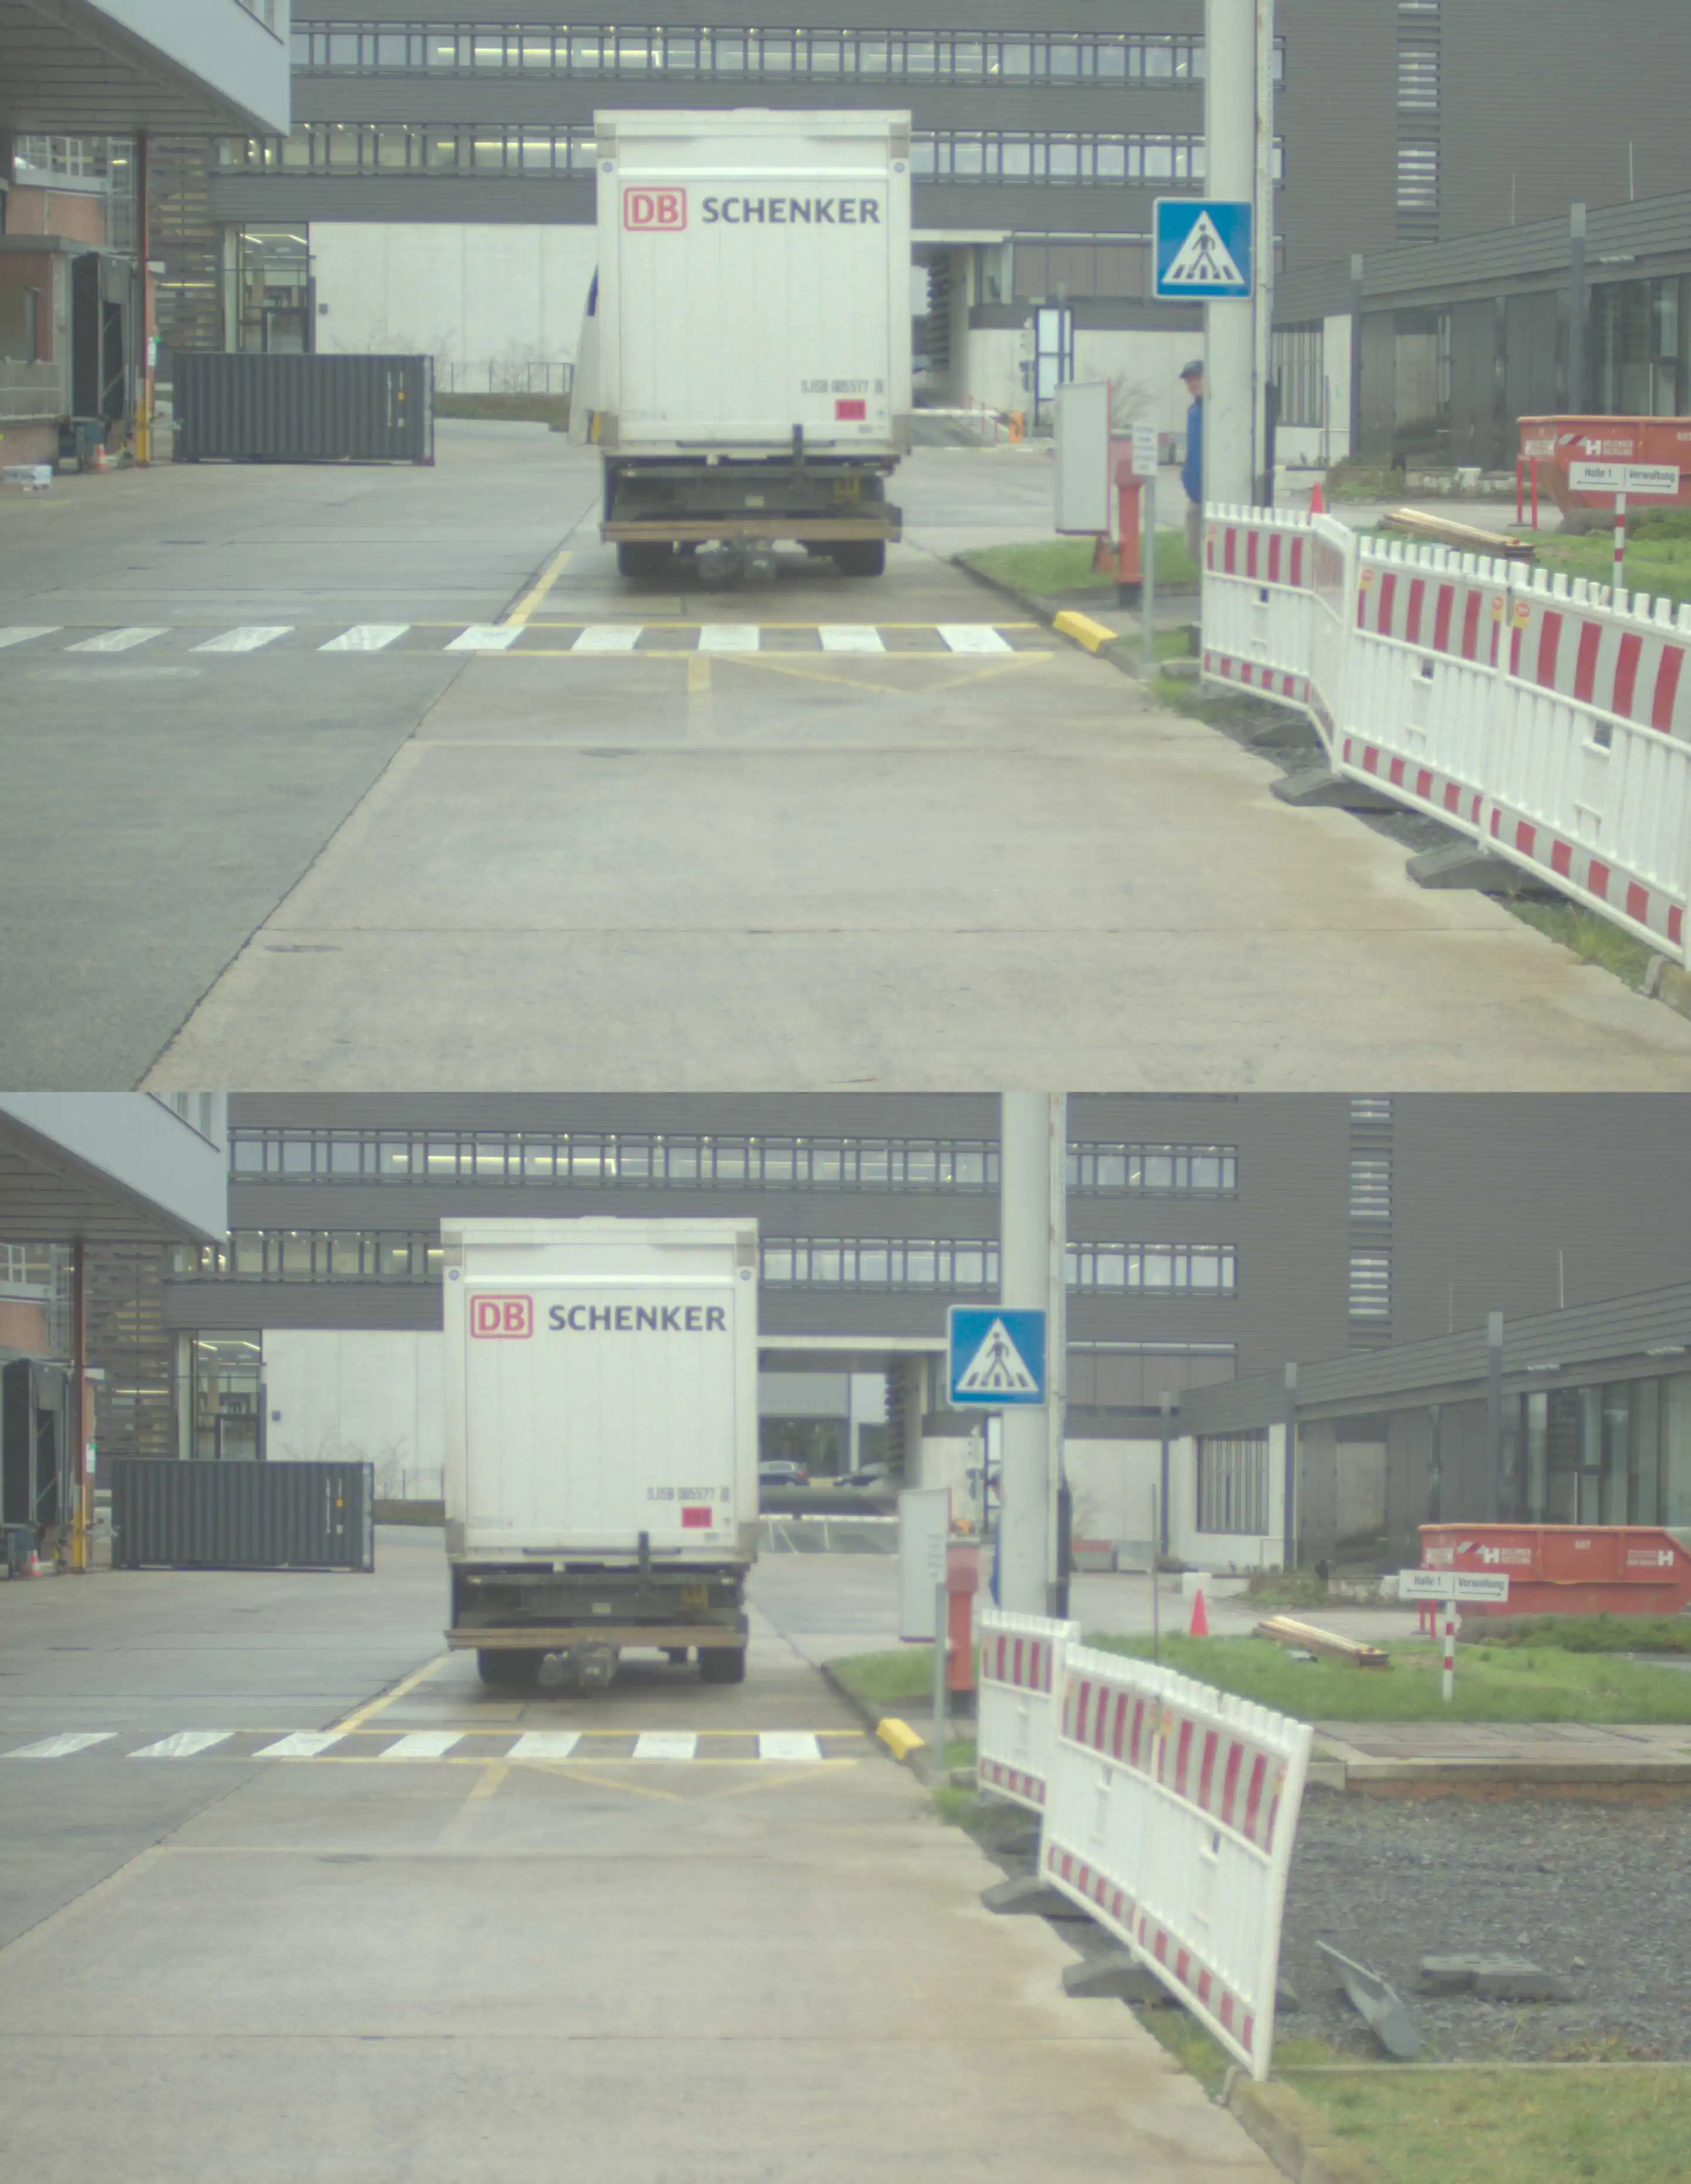
These are vertically concatenated raw images from the left and right camera as shown below:
Left-rectified Images
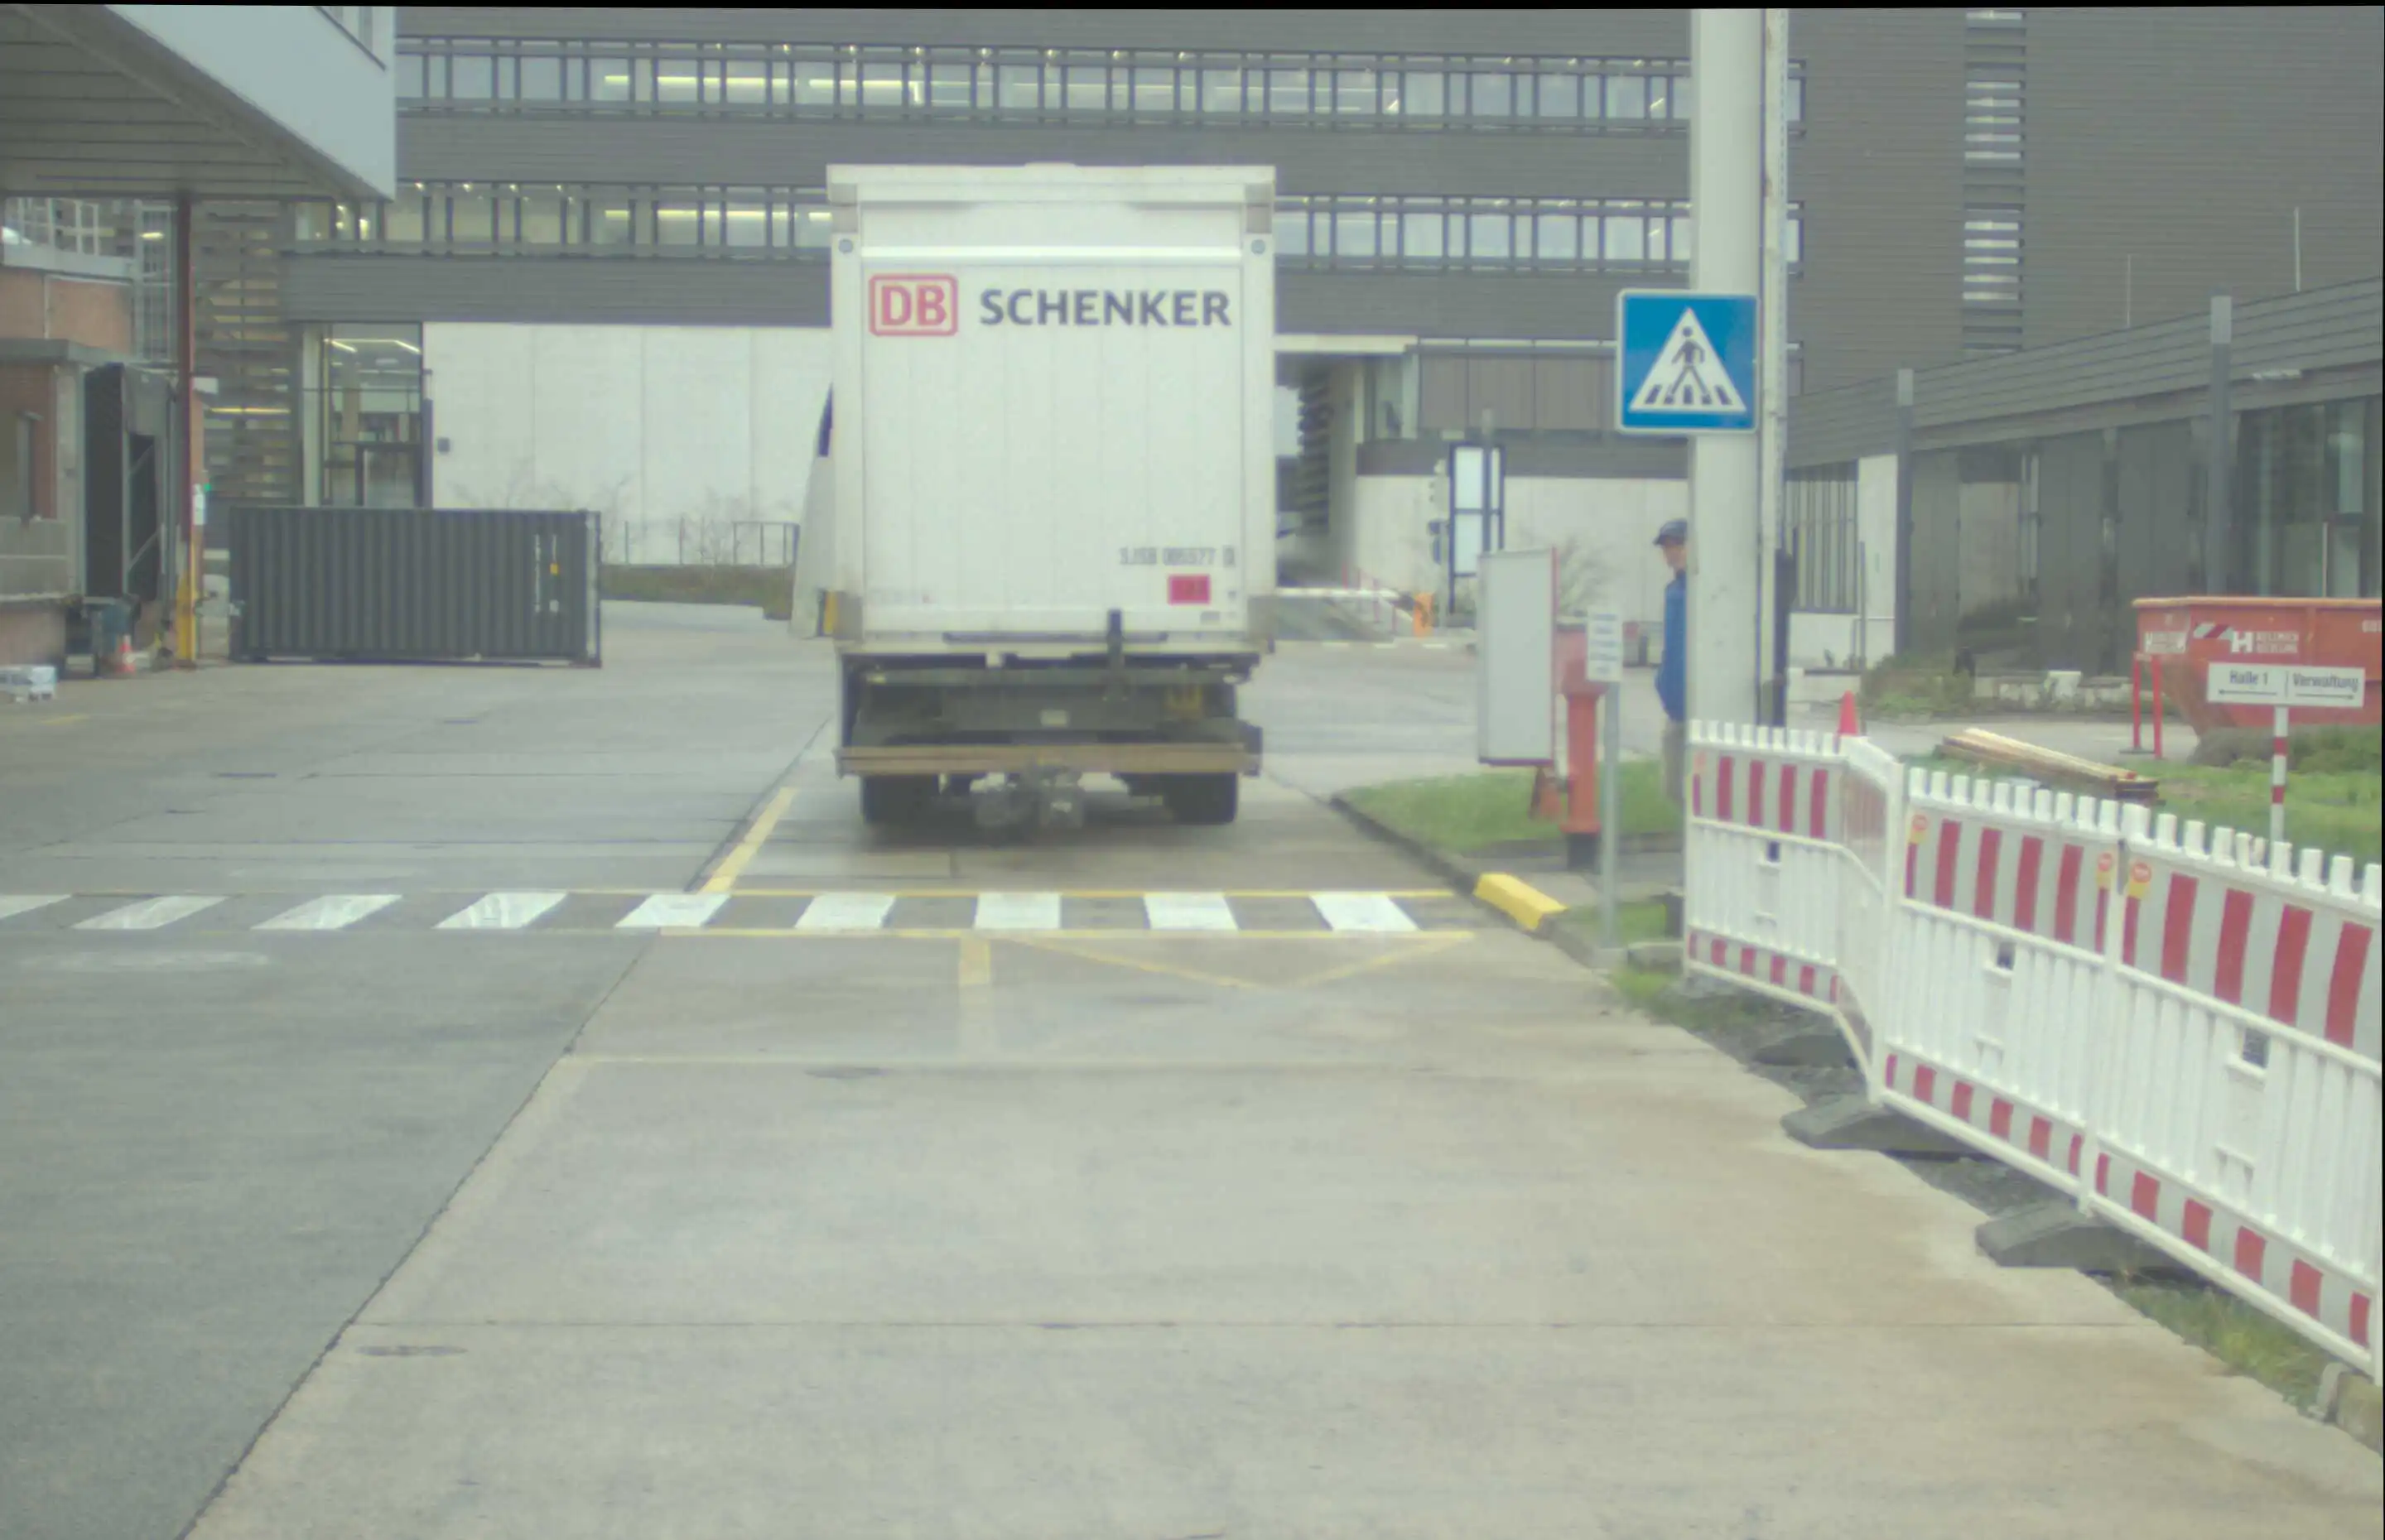
The left-rectified image shows the image from the left camera after rectification, as shown below:
Hammerhead and GridDetect Performance
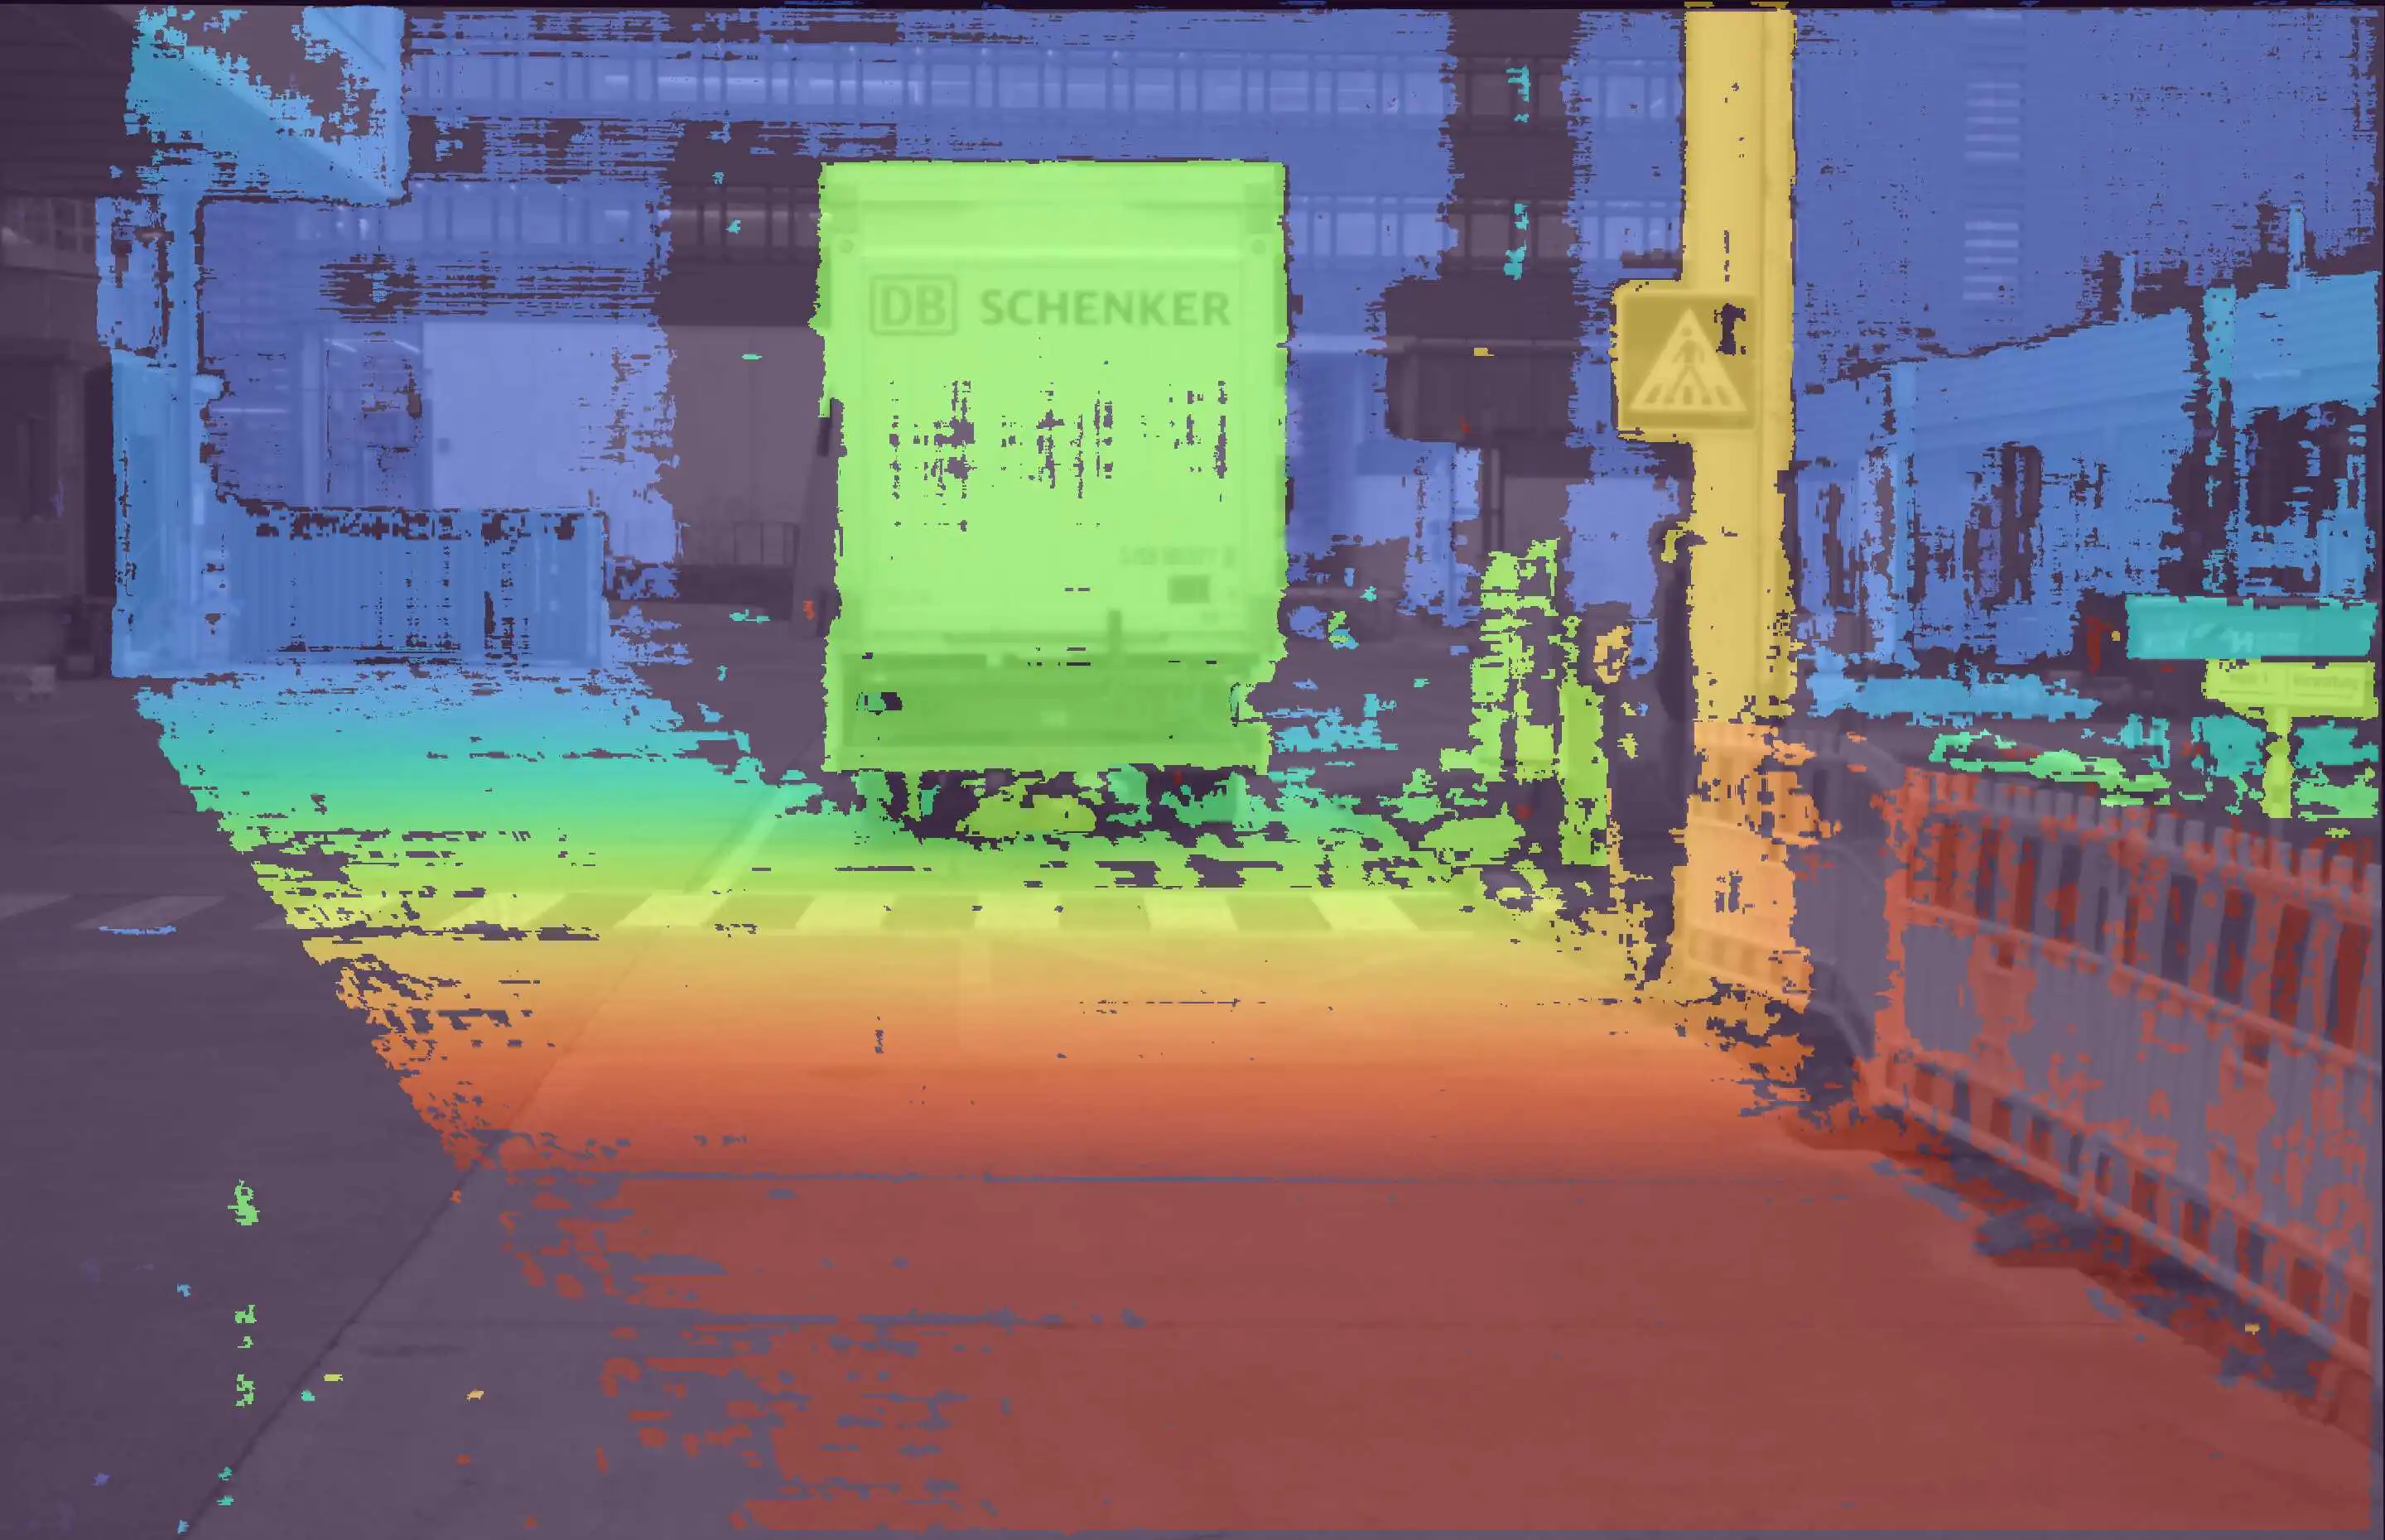
Depth Map
The depth map is an image, where each pixel corresponds its depth information in meters. It can be better visualized in the colored depth maps, with blended RGB channel shown below:
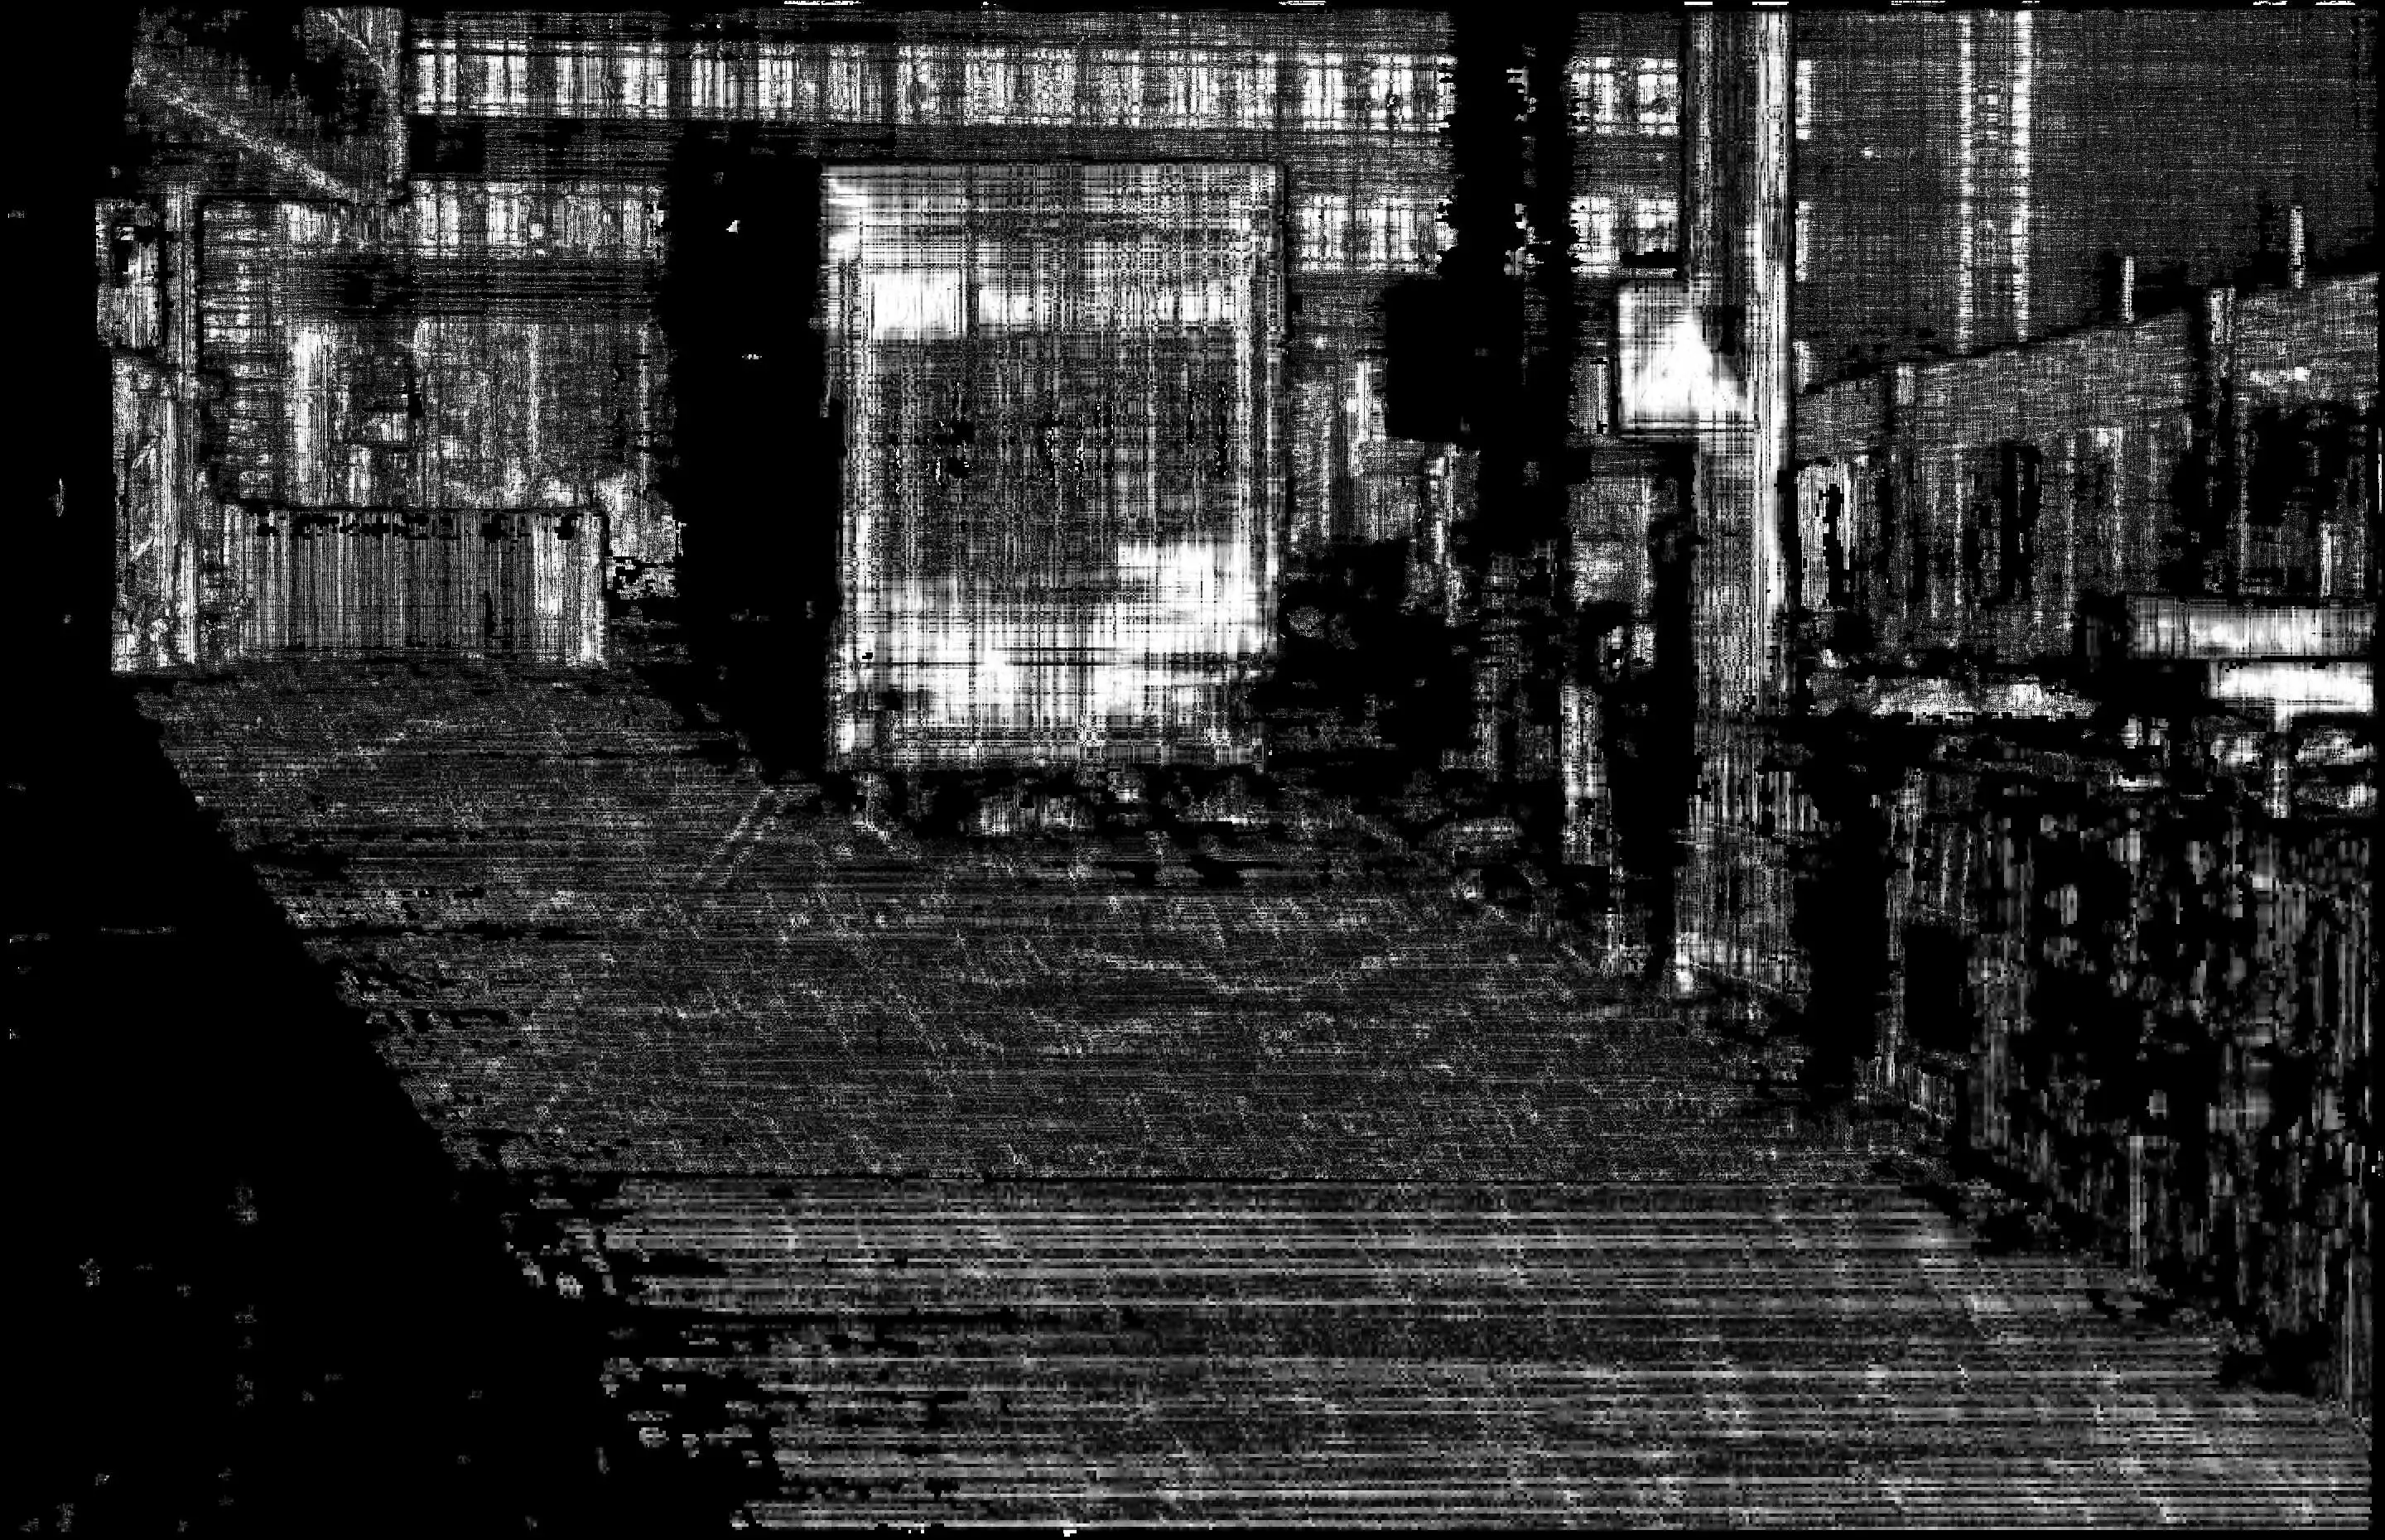
Confidence Map
The confidence map stores the confidence in the depth information produced by our stereo-matching algorithm, as shown below:
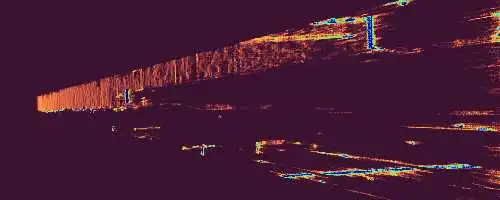
BEV Visualization
The Bird's Eye View (BEV) is a discrete representation of the point cloud looking from a top view. Each grid cell is 0.2m-by-0.2m, and the color of a grid cell in BEV encodes the density of points it accommodates. Consequently, objects on the road appear brighter in BEV. The forward direction (z-axis) is encoded along the horizontal dimension and captures up to a range of 100 m, while the lateral direction (x-axis) is encoded in the vertical dimension of BEV.
Object Detection
Our detection module compresses the dense pointcloud data into succinct bounding boxes around objects, in BEV. It also accounts for temporal correlations, enabling it to assess relative velocity of the objects in the X-Z plane. The output is a .csv file and each row stores the locations of the 3 consecutive corners of the bounding box (x1, z1, …) in meters, and relative velocity along x and z directions (vx, vz) in m/s. This is followed by the coordinates of the cells that are occupied by the object in BEV. The bounding boxes can be visualized through our viewer by checking the box "Display Boxes" in the "Point Cloud" window.