NODAR Viewer User Interface
Running the Viewer
To launch the viewer, run the nodar_viewer command in the terminal.
User Interface
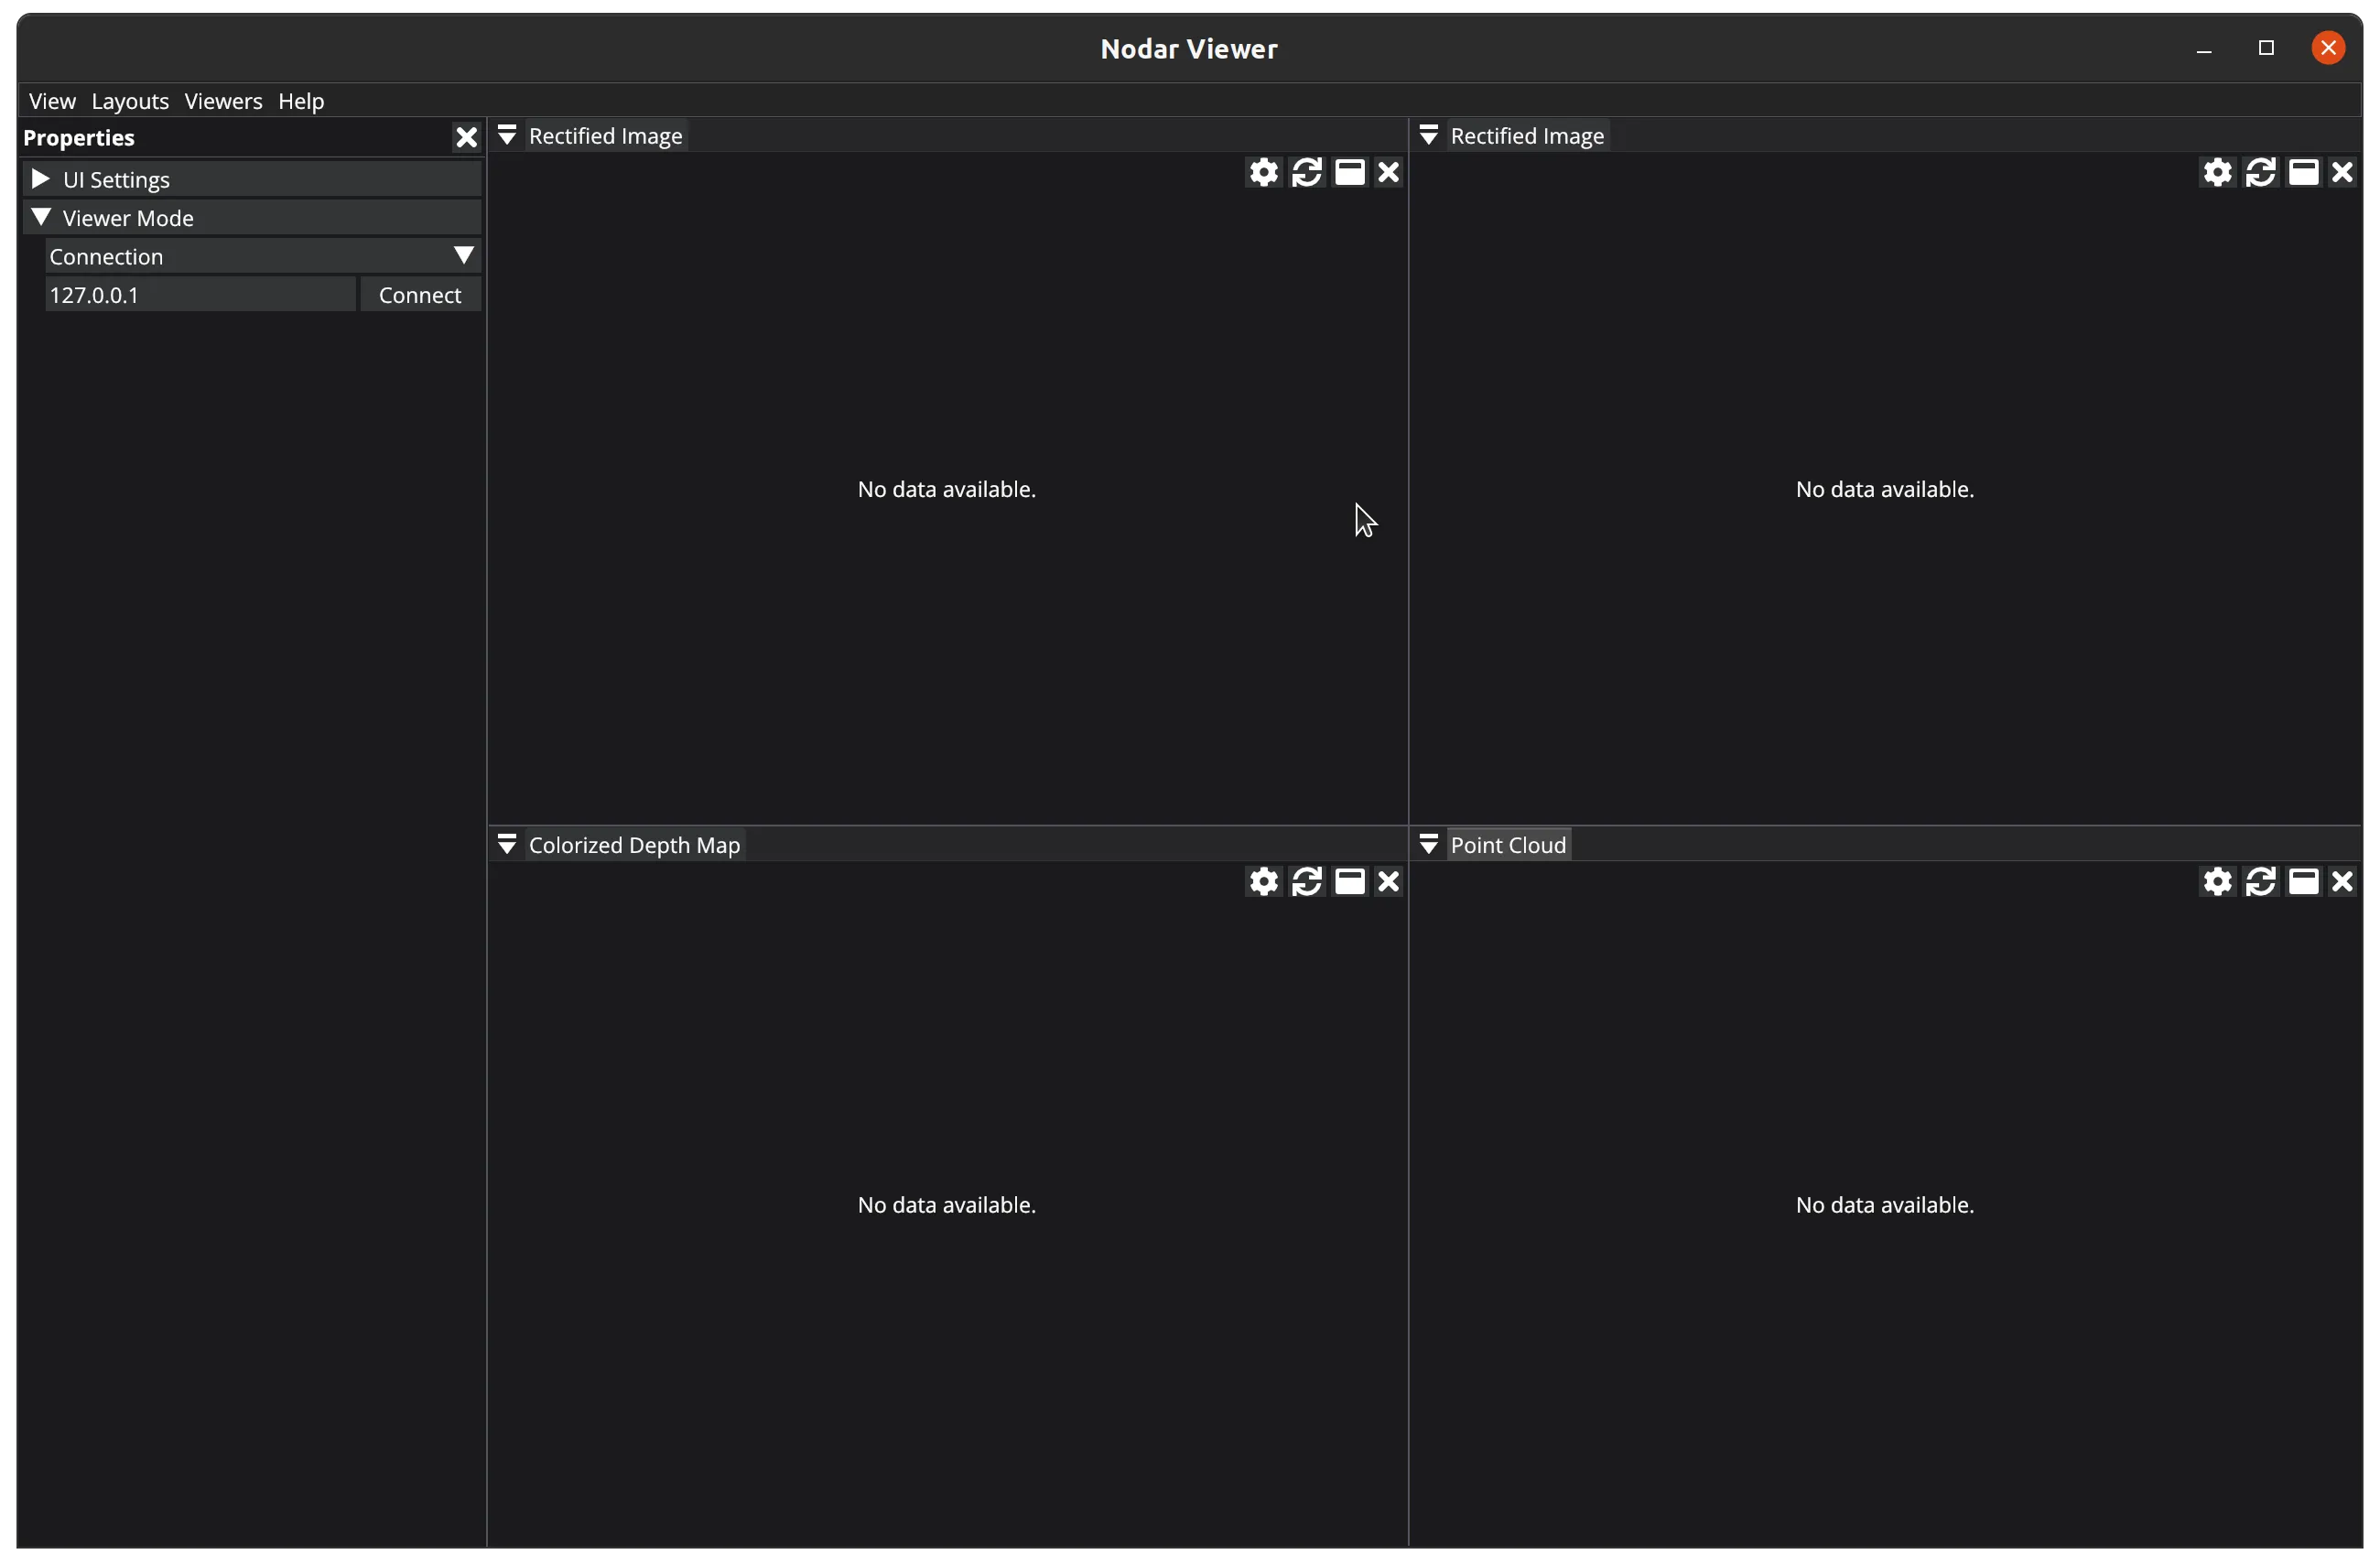
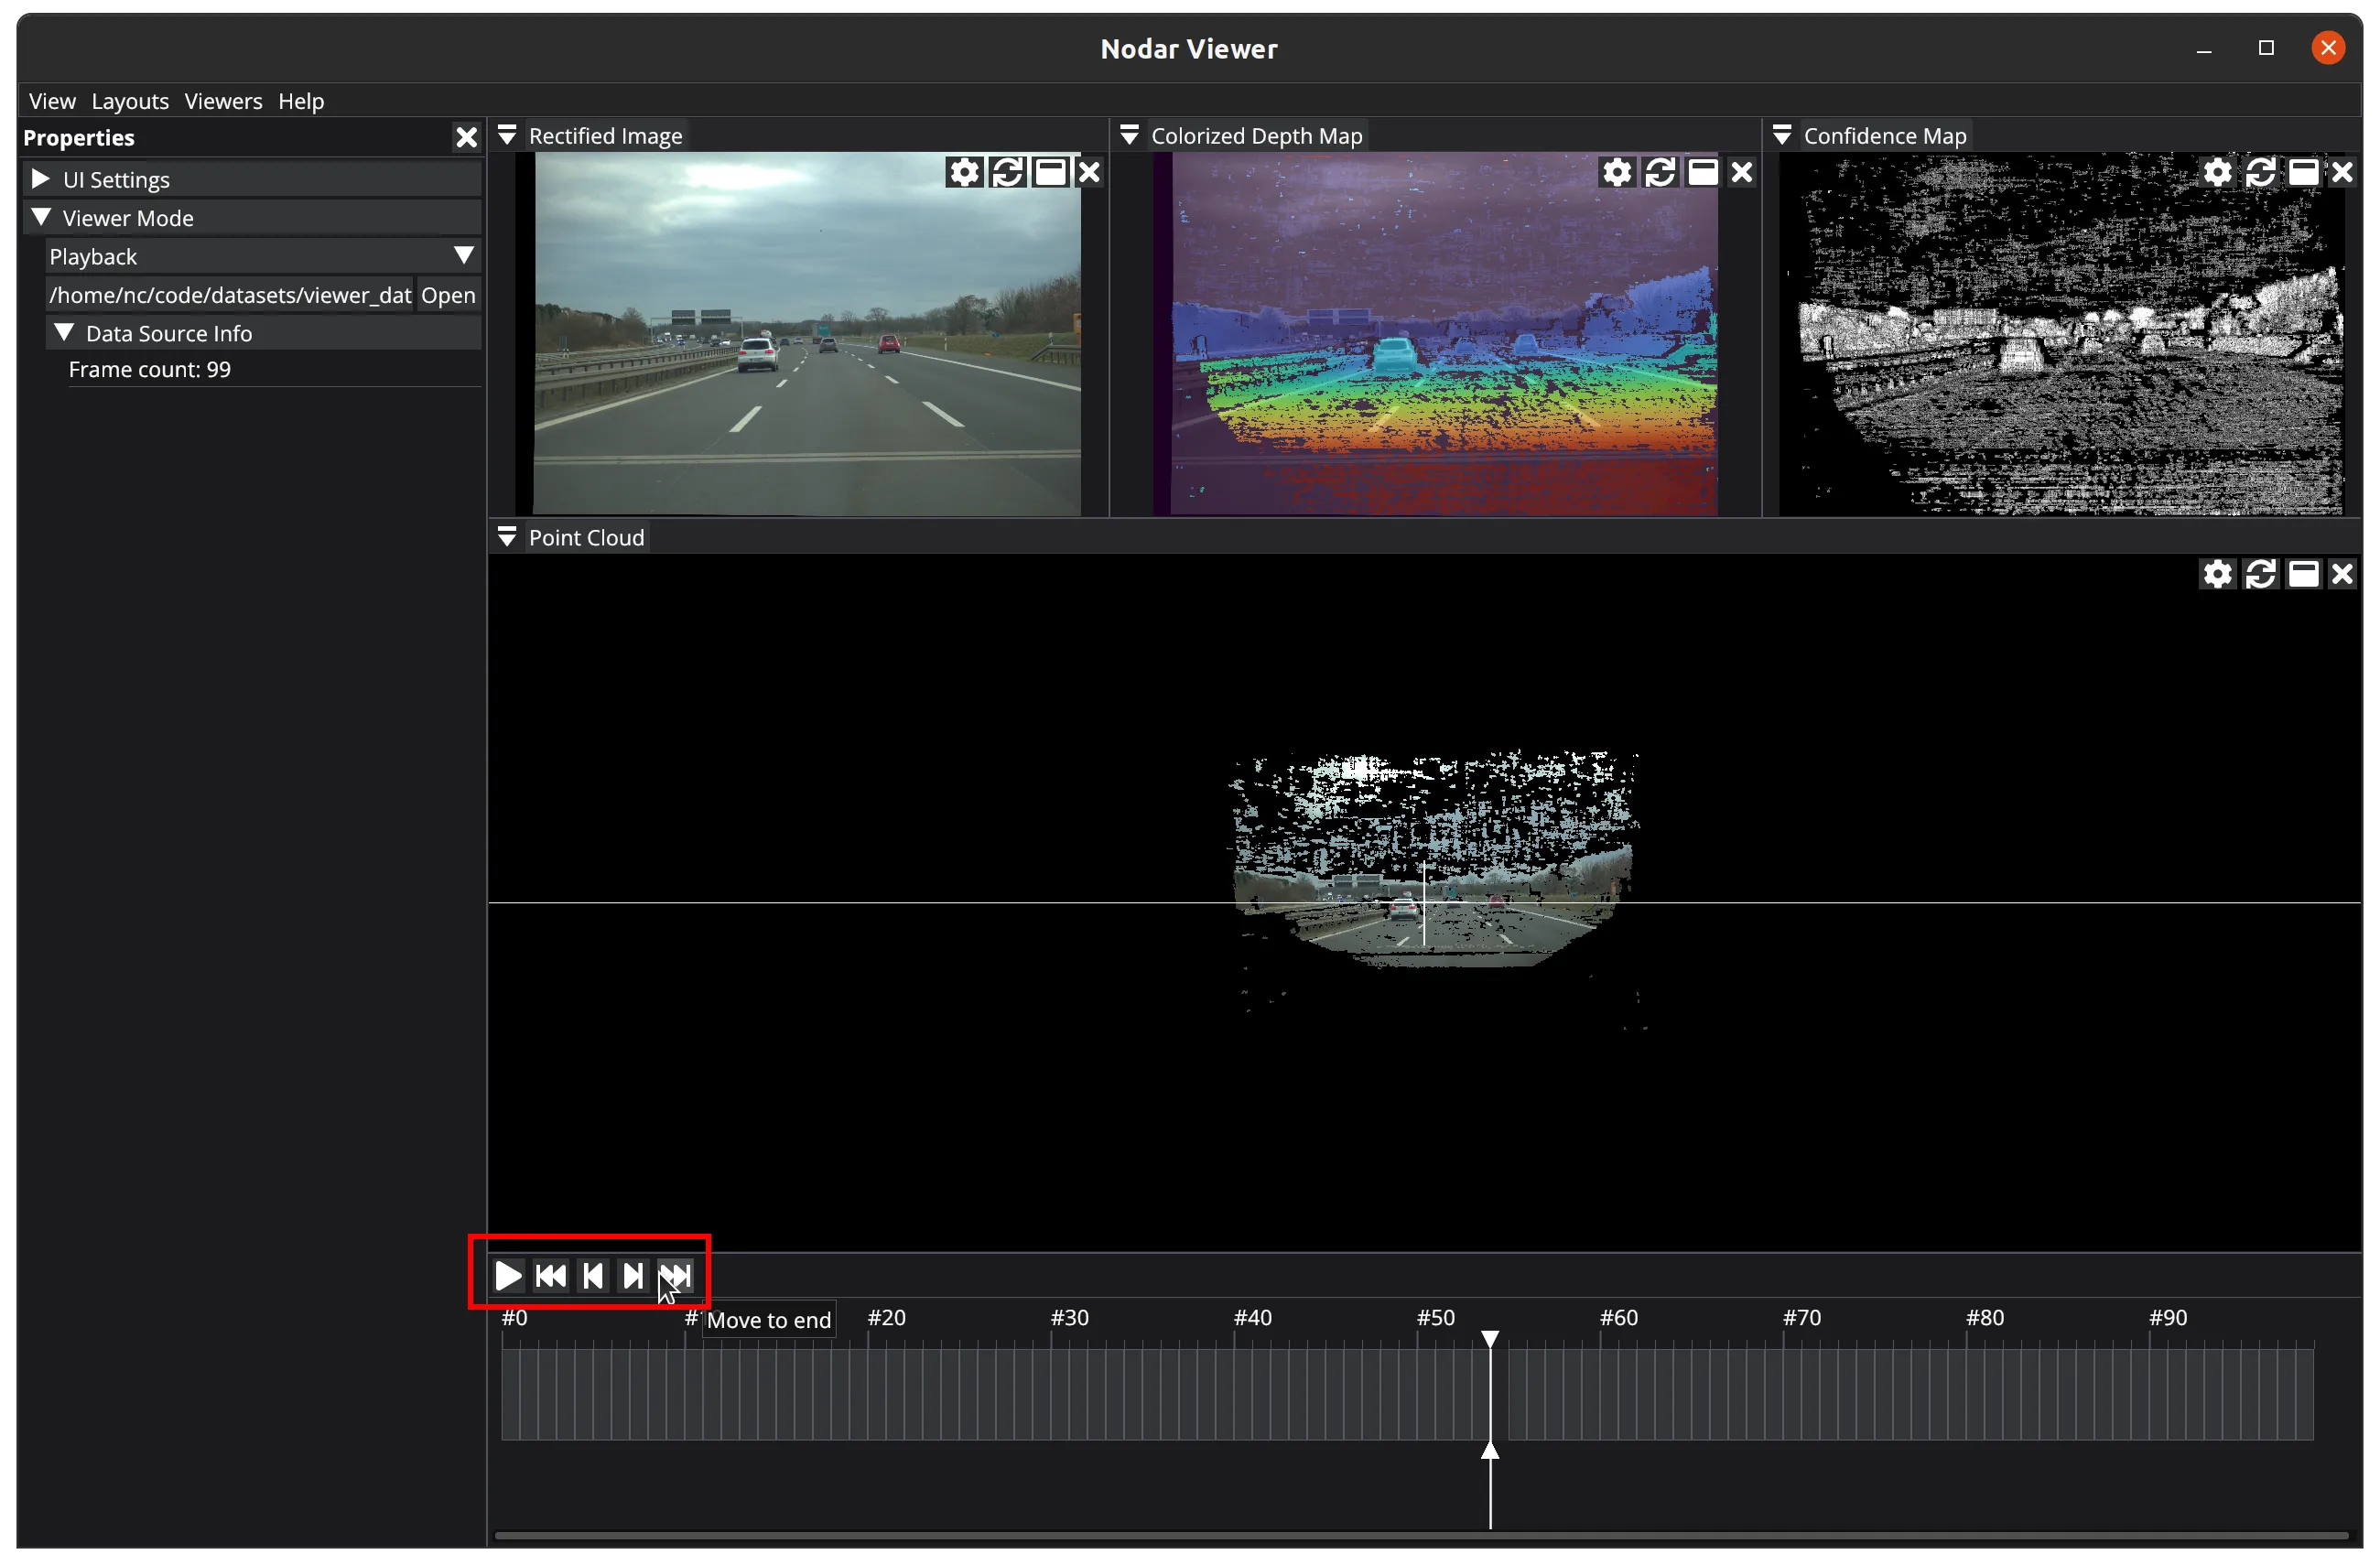
When you run the viewer for the first time, the application opens in its default layout:
When you modify the layout by resizing, opening, or closing viewers, the application will save your changes to ~/.config/viewer_config.yaml upon closing with the close button.
Menus
View
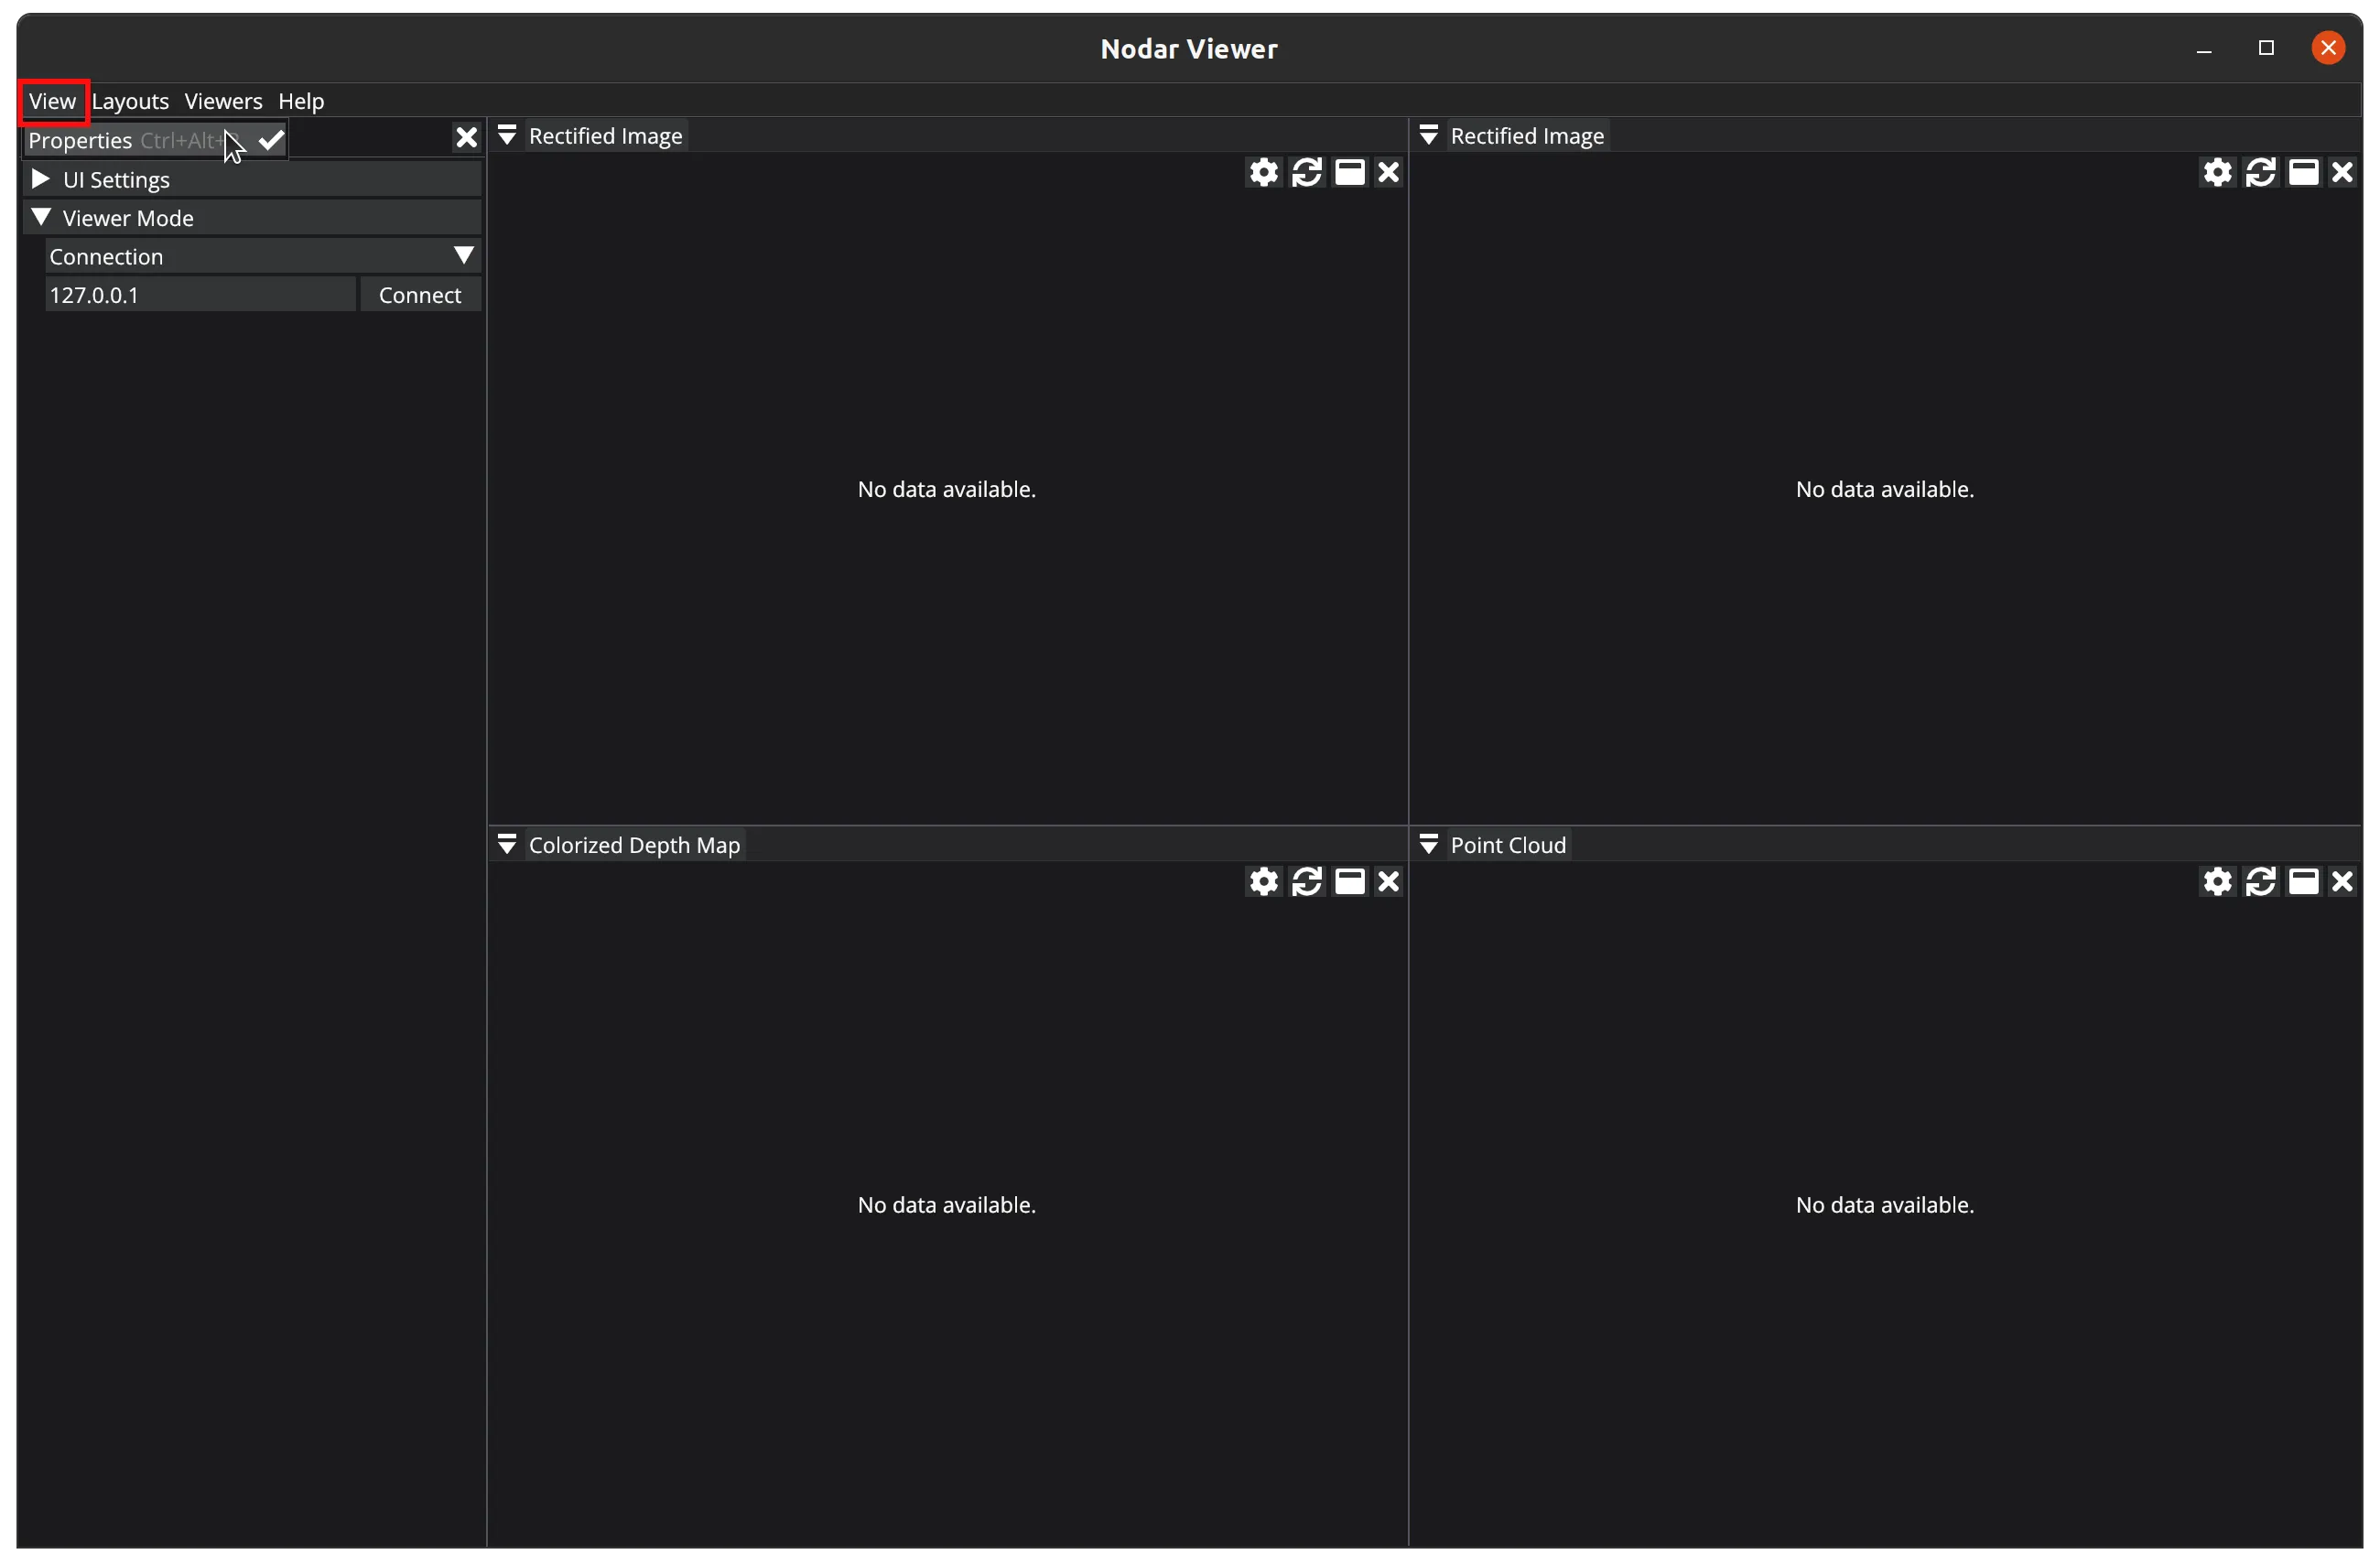
In the View menu, you can open or close the left properties panel. You can also use the Ctrl+Alt+P shortcut.
Layouts
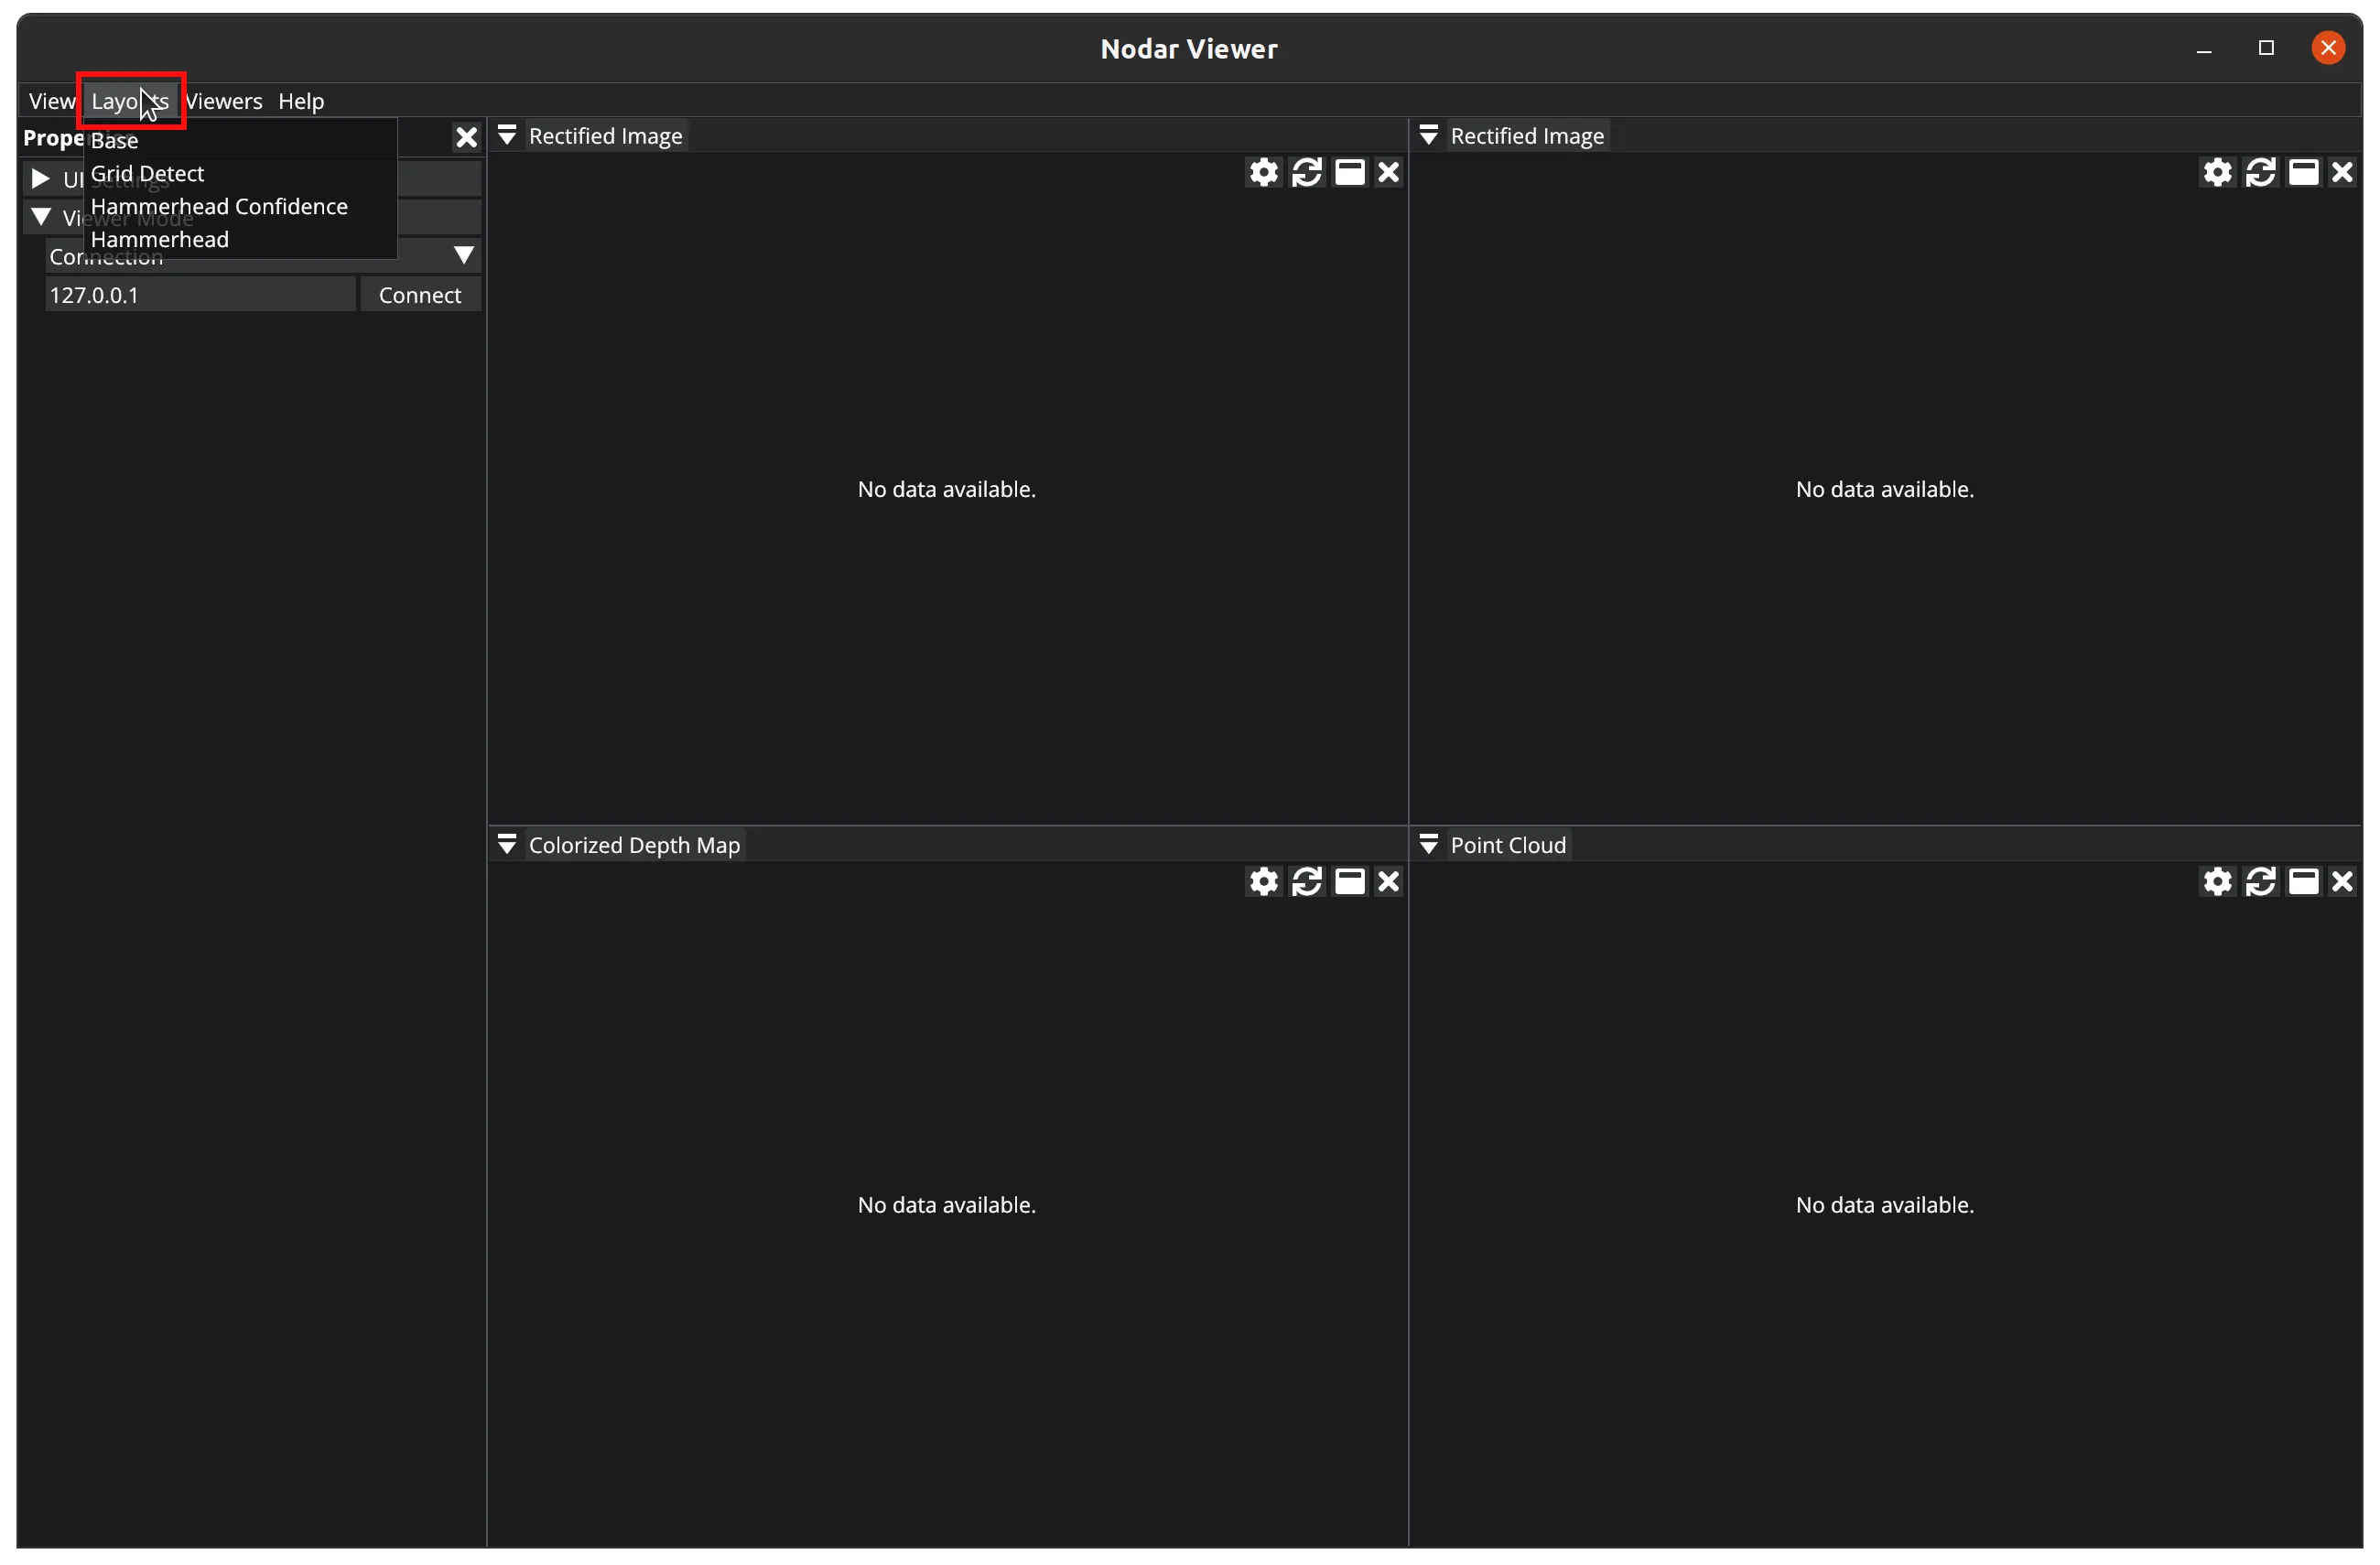
In the Layouts menu, you can select from several predefined UI layouts. The Base layout (shown in the image above) is selected by default.
Viewers
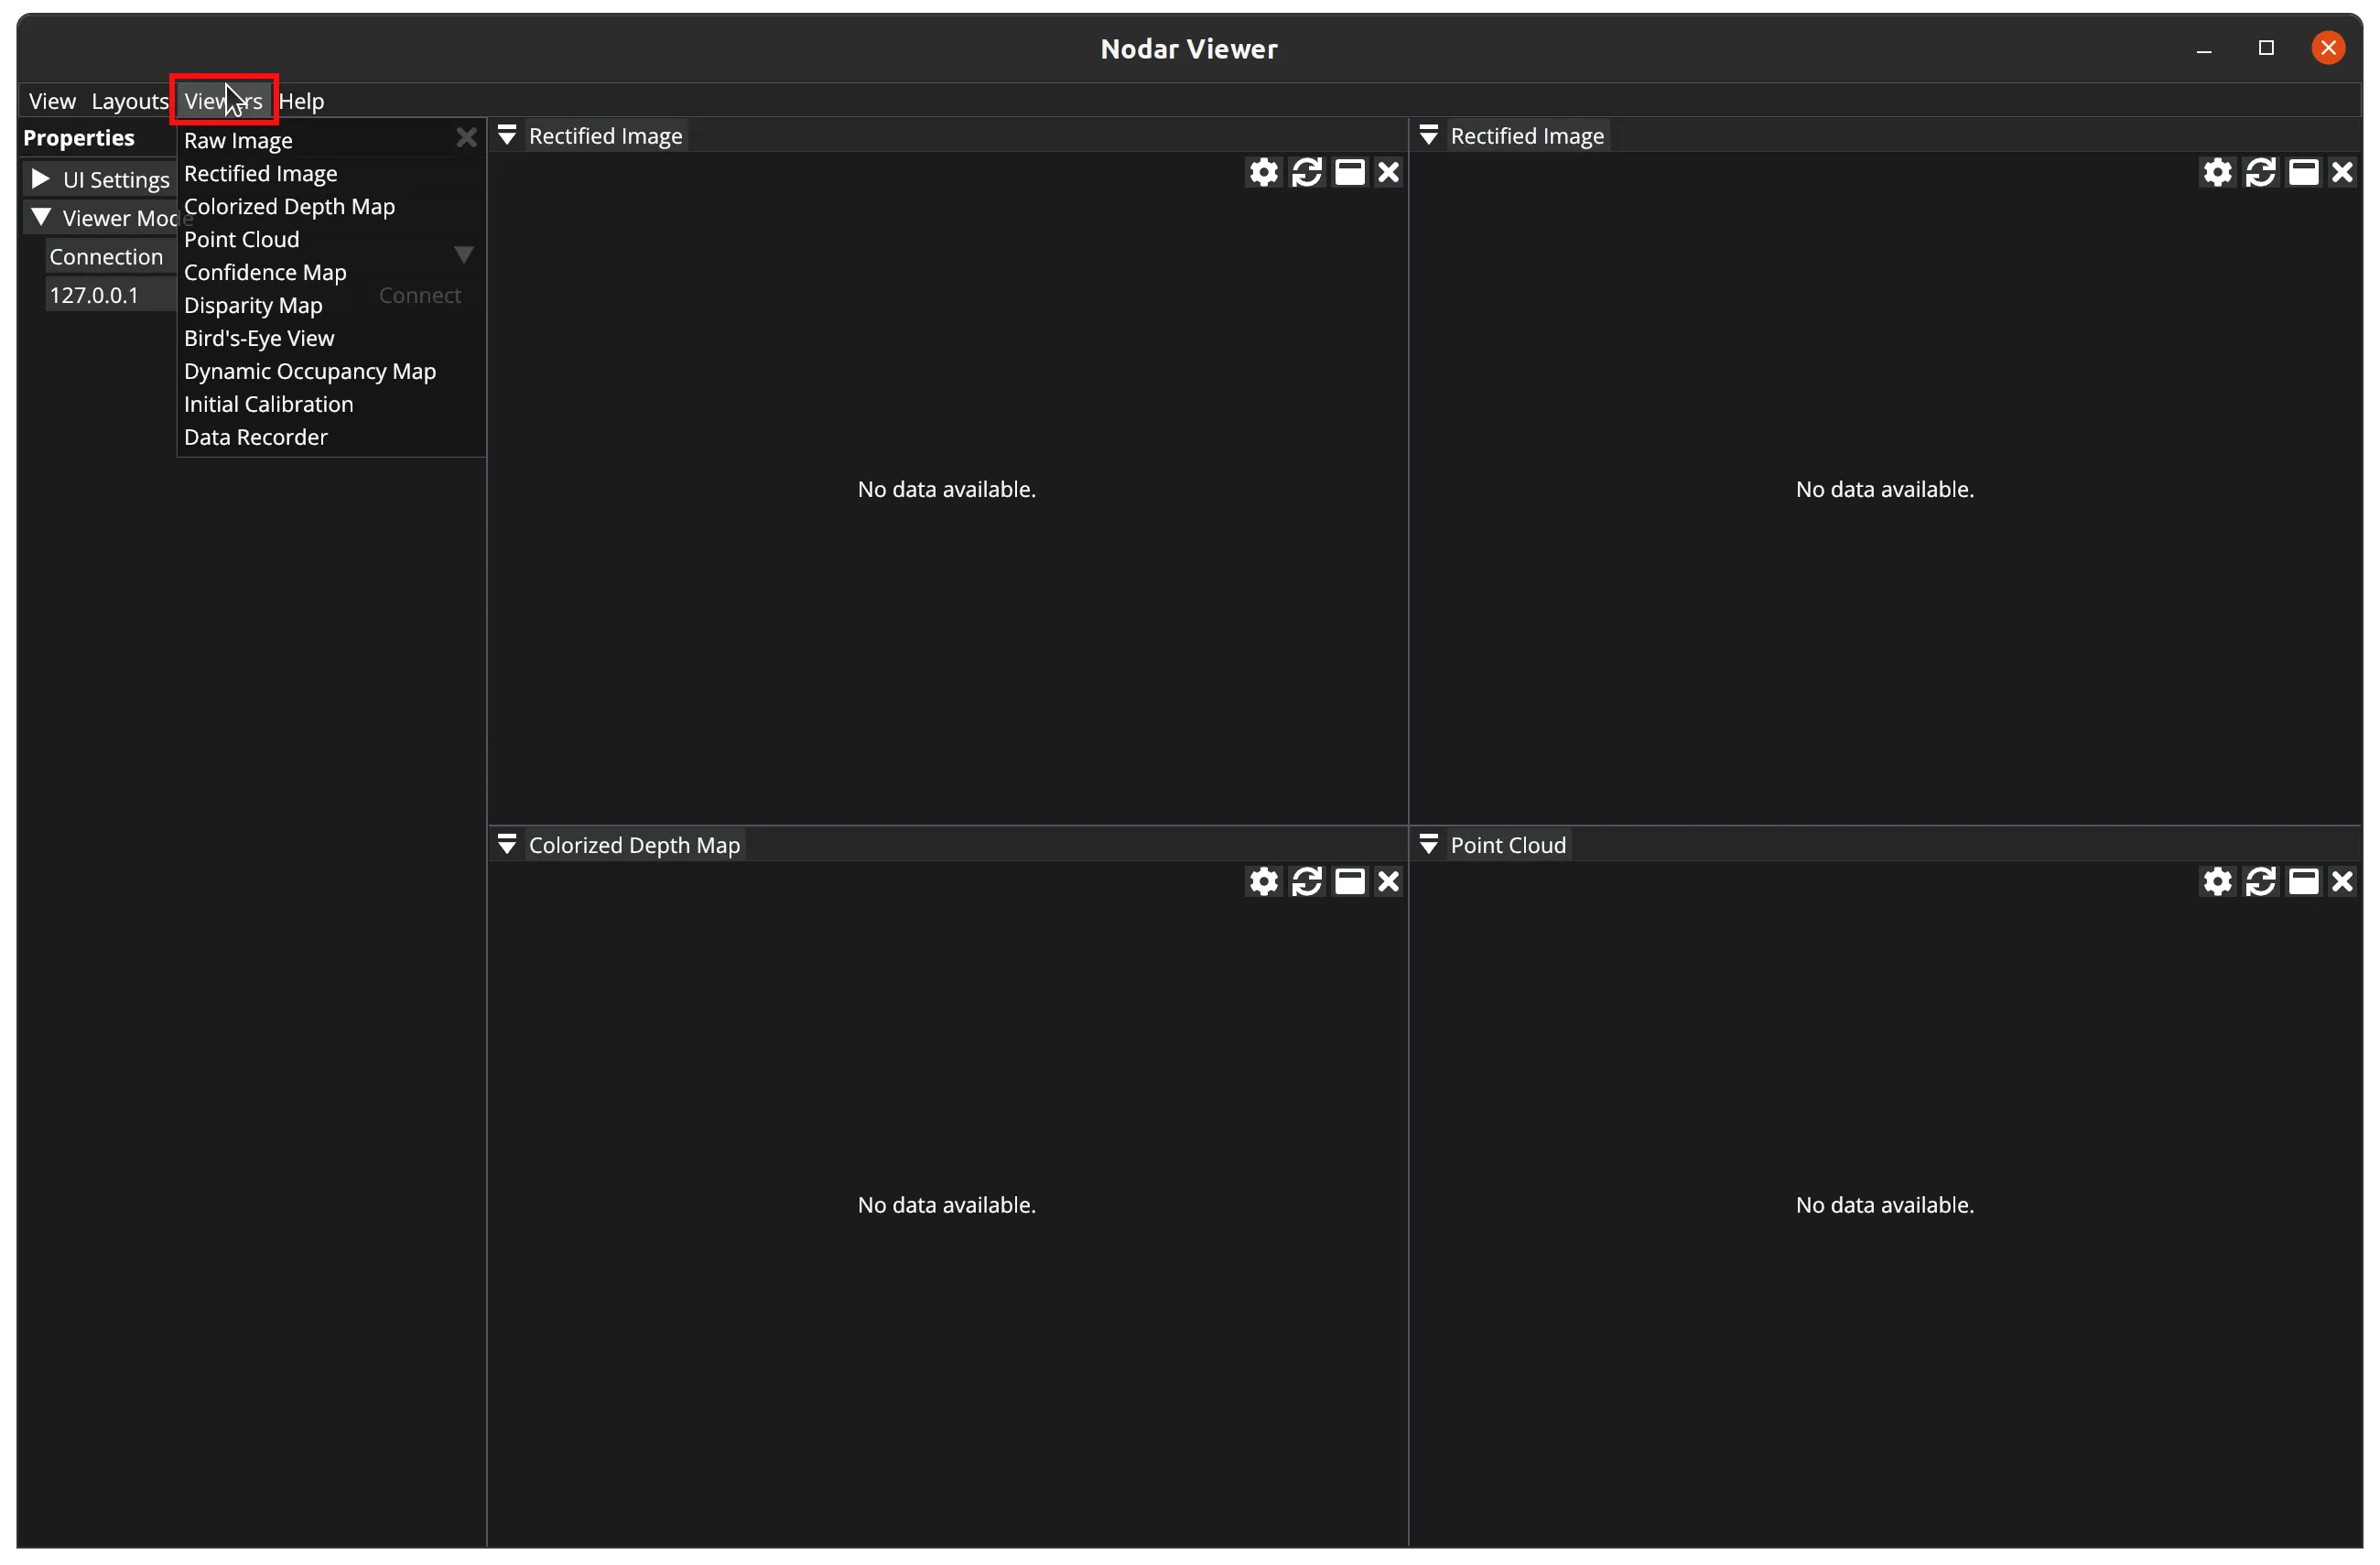
The Viewers menu lets you open data visualizers. The image above shows four open viewers: two Rectified Image viewers, one Colorized Depth Map, and one Point Cloud.
Help
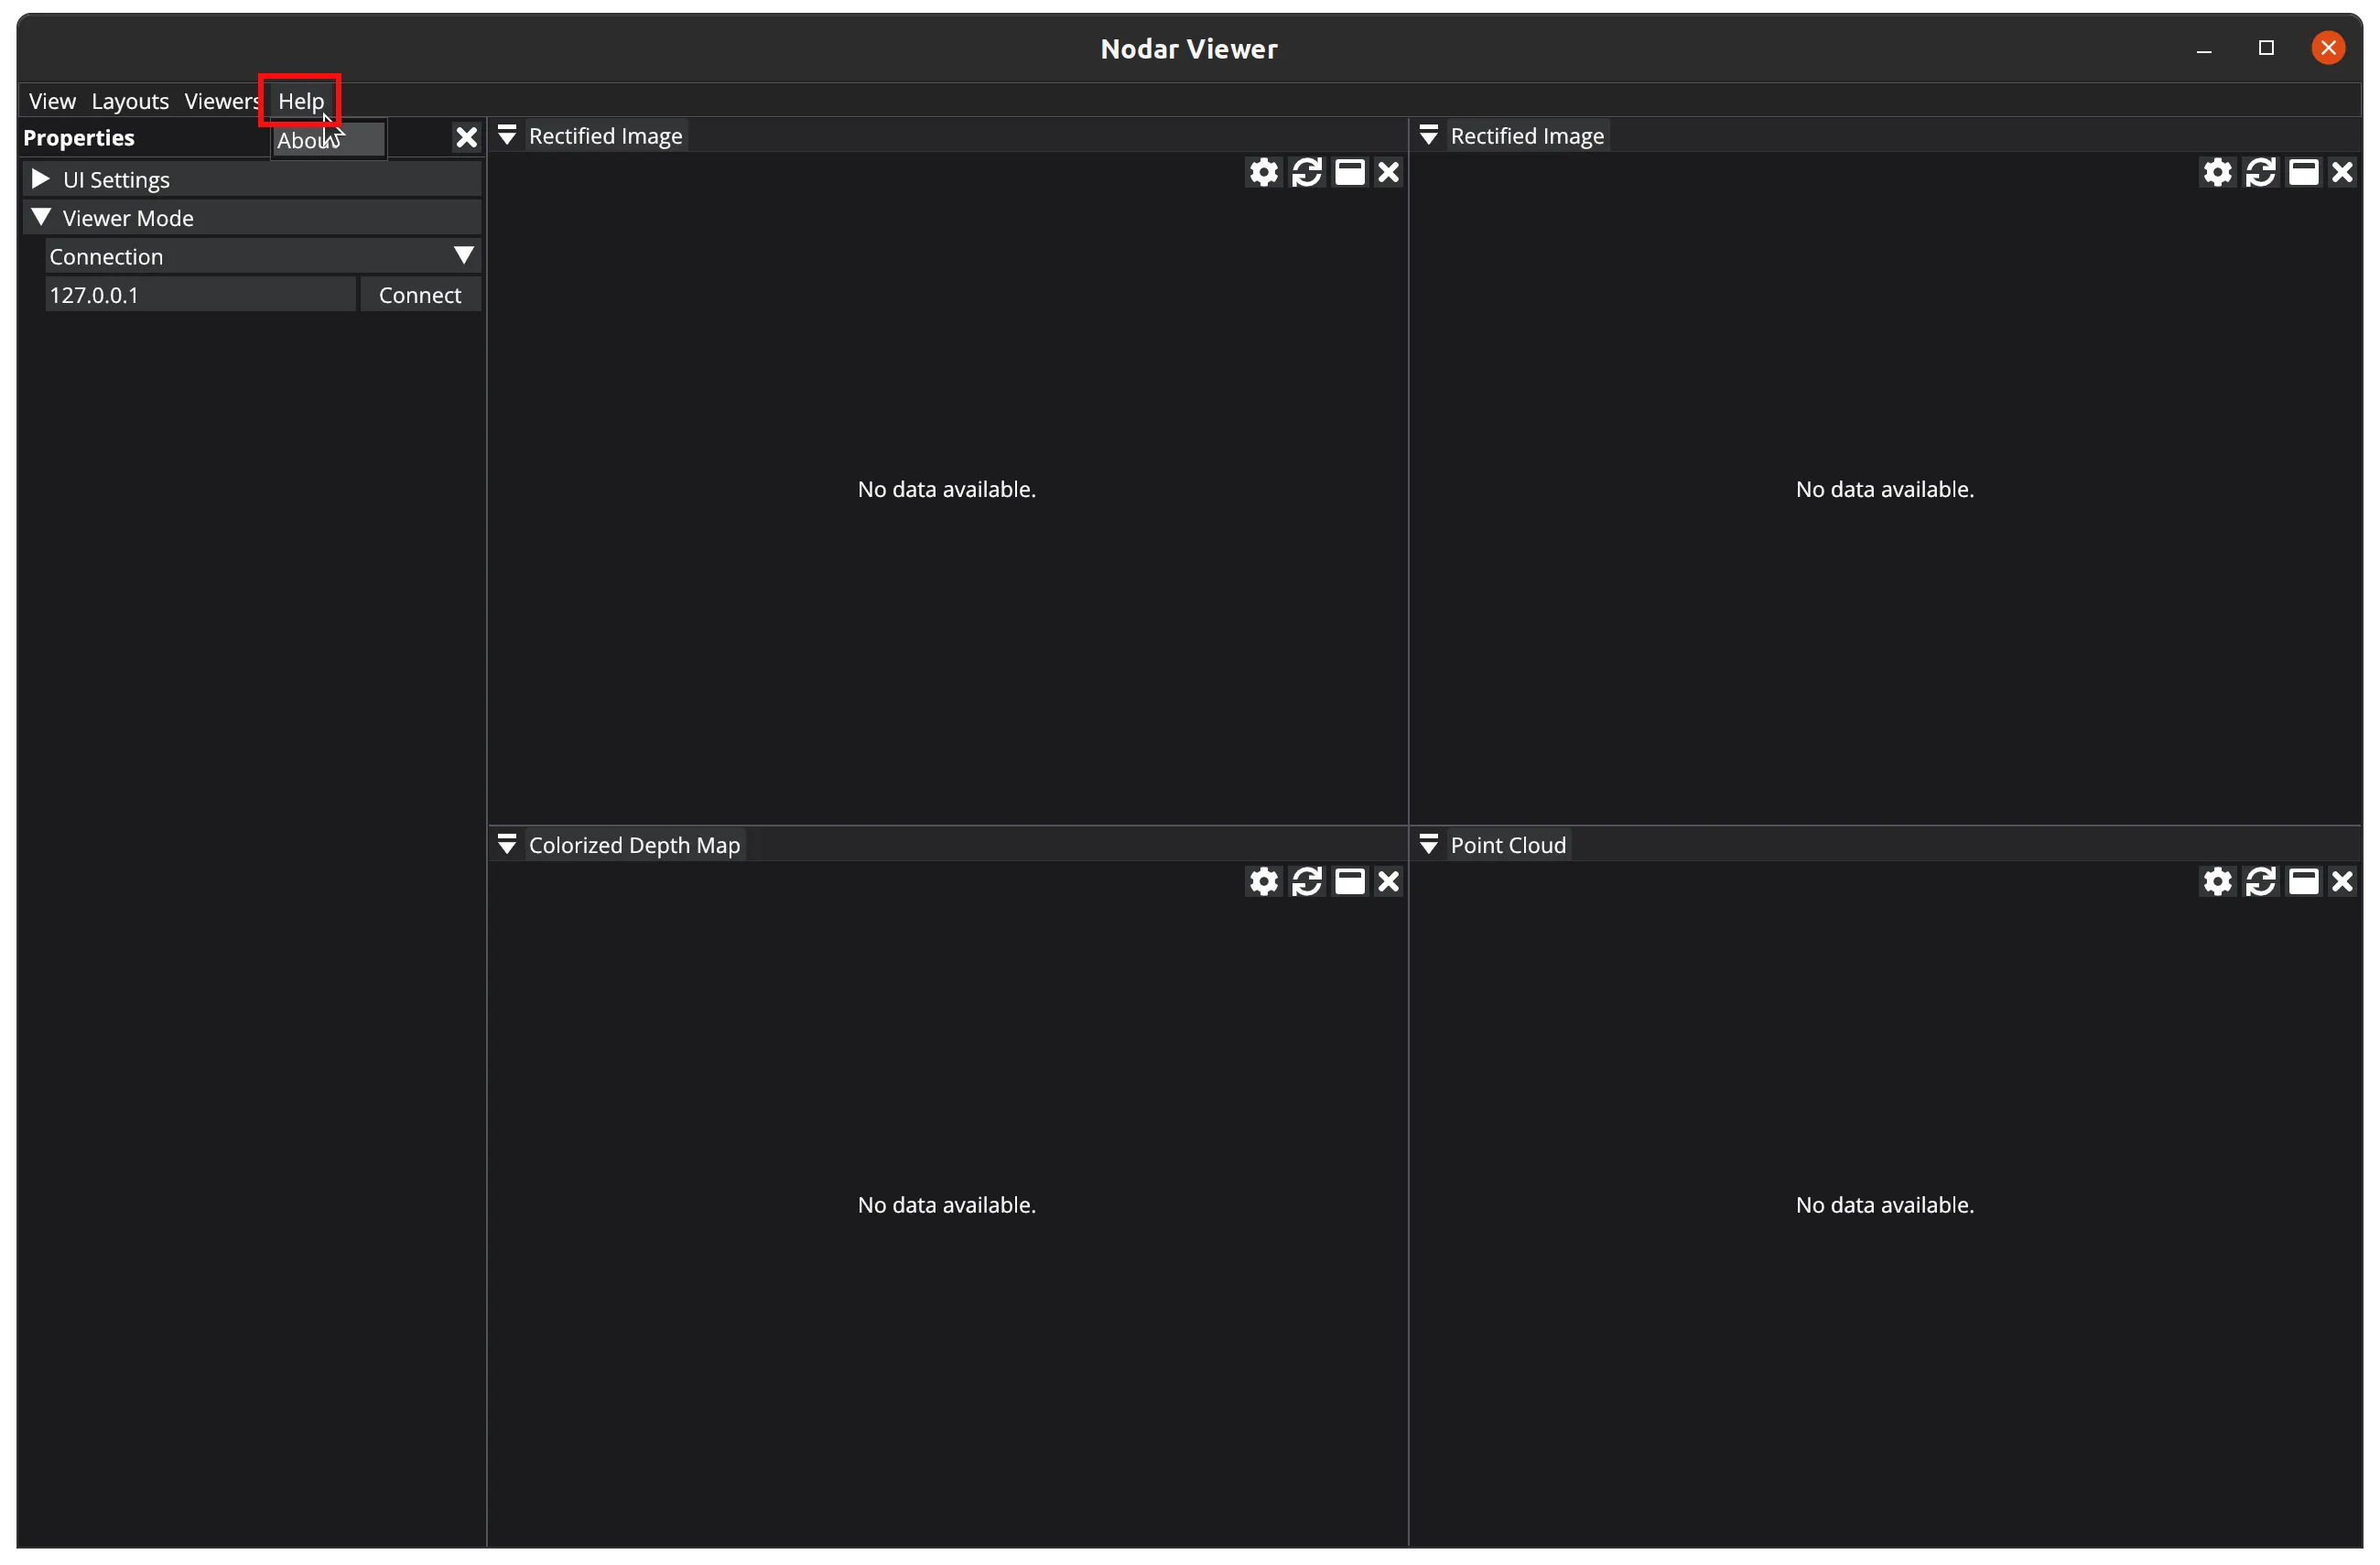
The Help > About menu opens a window that displays the application's version number and lists all third-party libraries used.
Properties
The main properties panel contains collapsible sections that you can expand or collapse by clicking their headers.
UI Settings
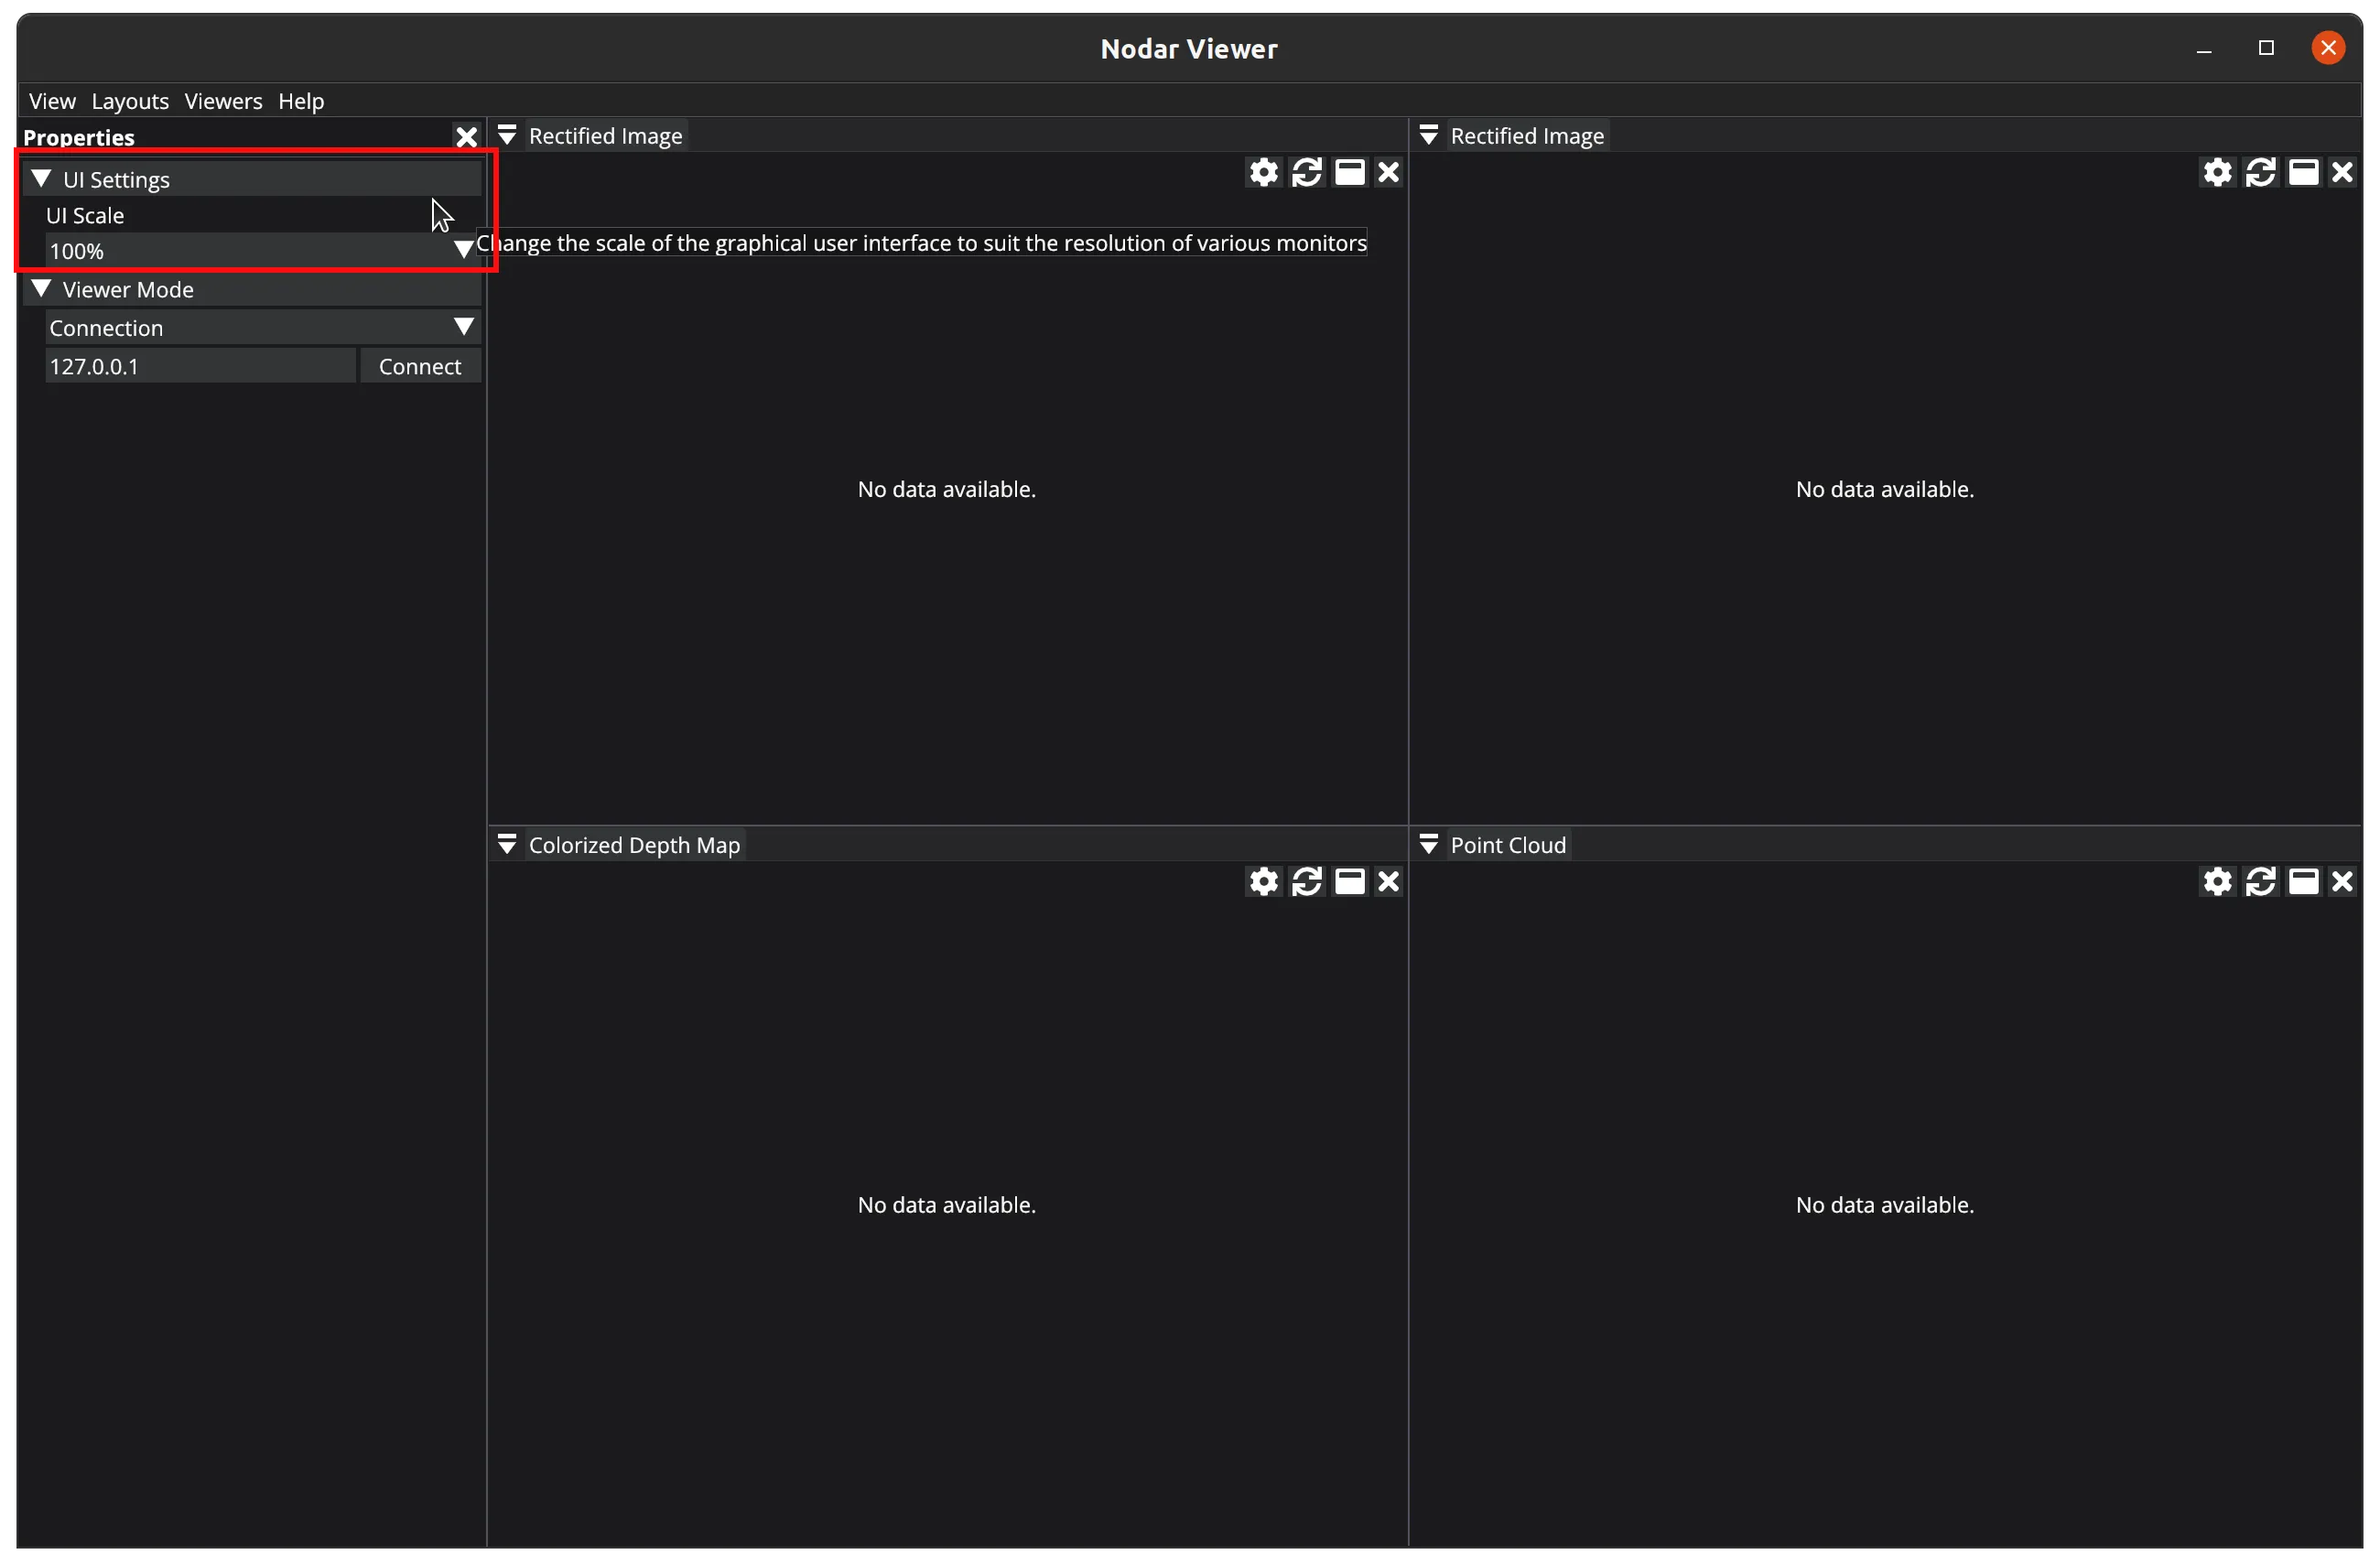
The UI Settings section allows you to adjust the application's global font size. You may want to increase the font size on high DPI monitors to improve readability.
Viewer Mode
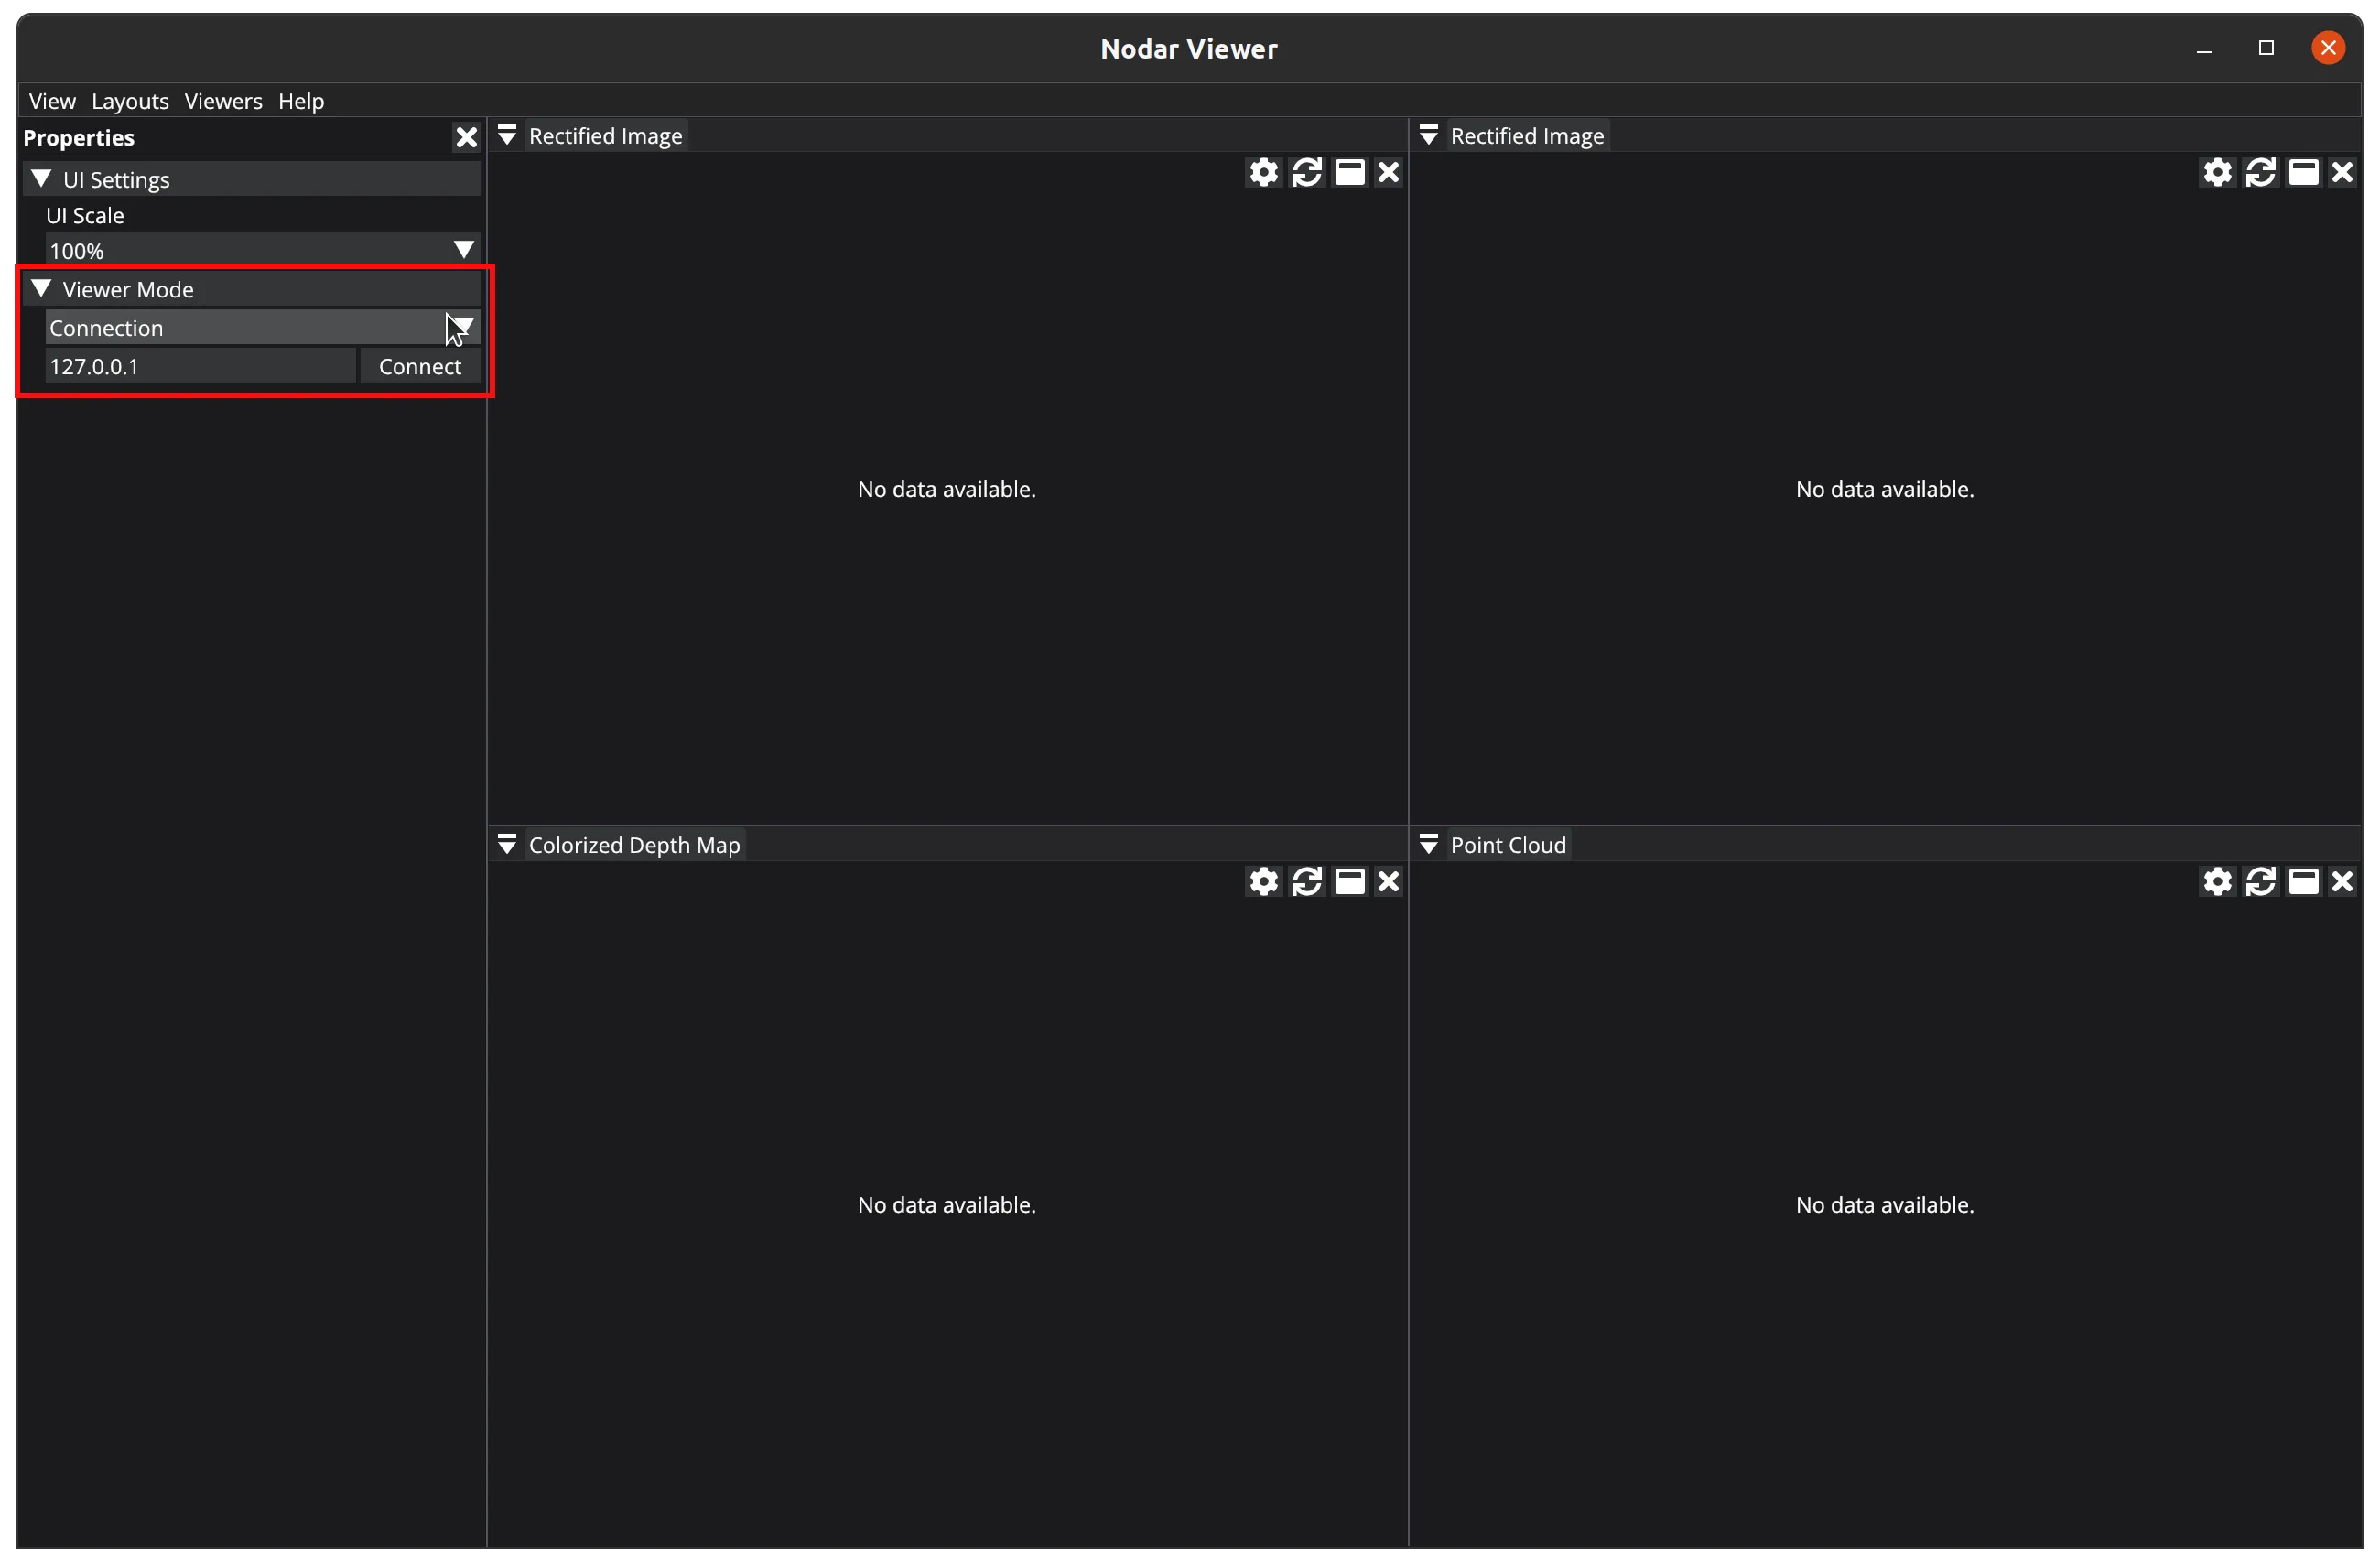
In the Viewer Mode section, you can select the viewer's operation mode. Note that some data viewers are only available for specific modes.
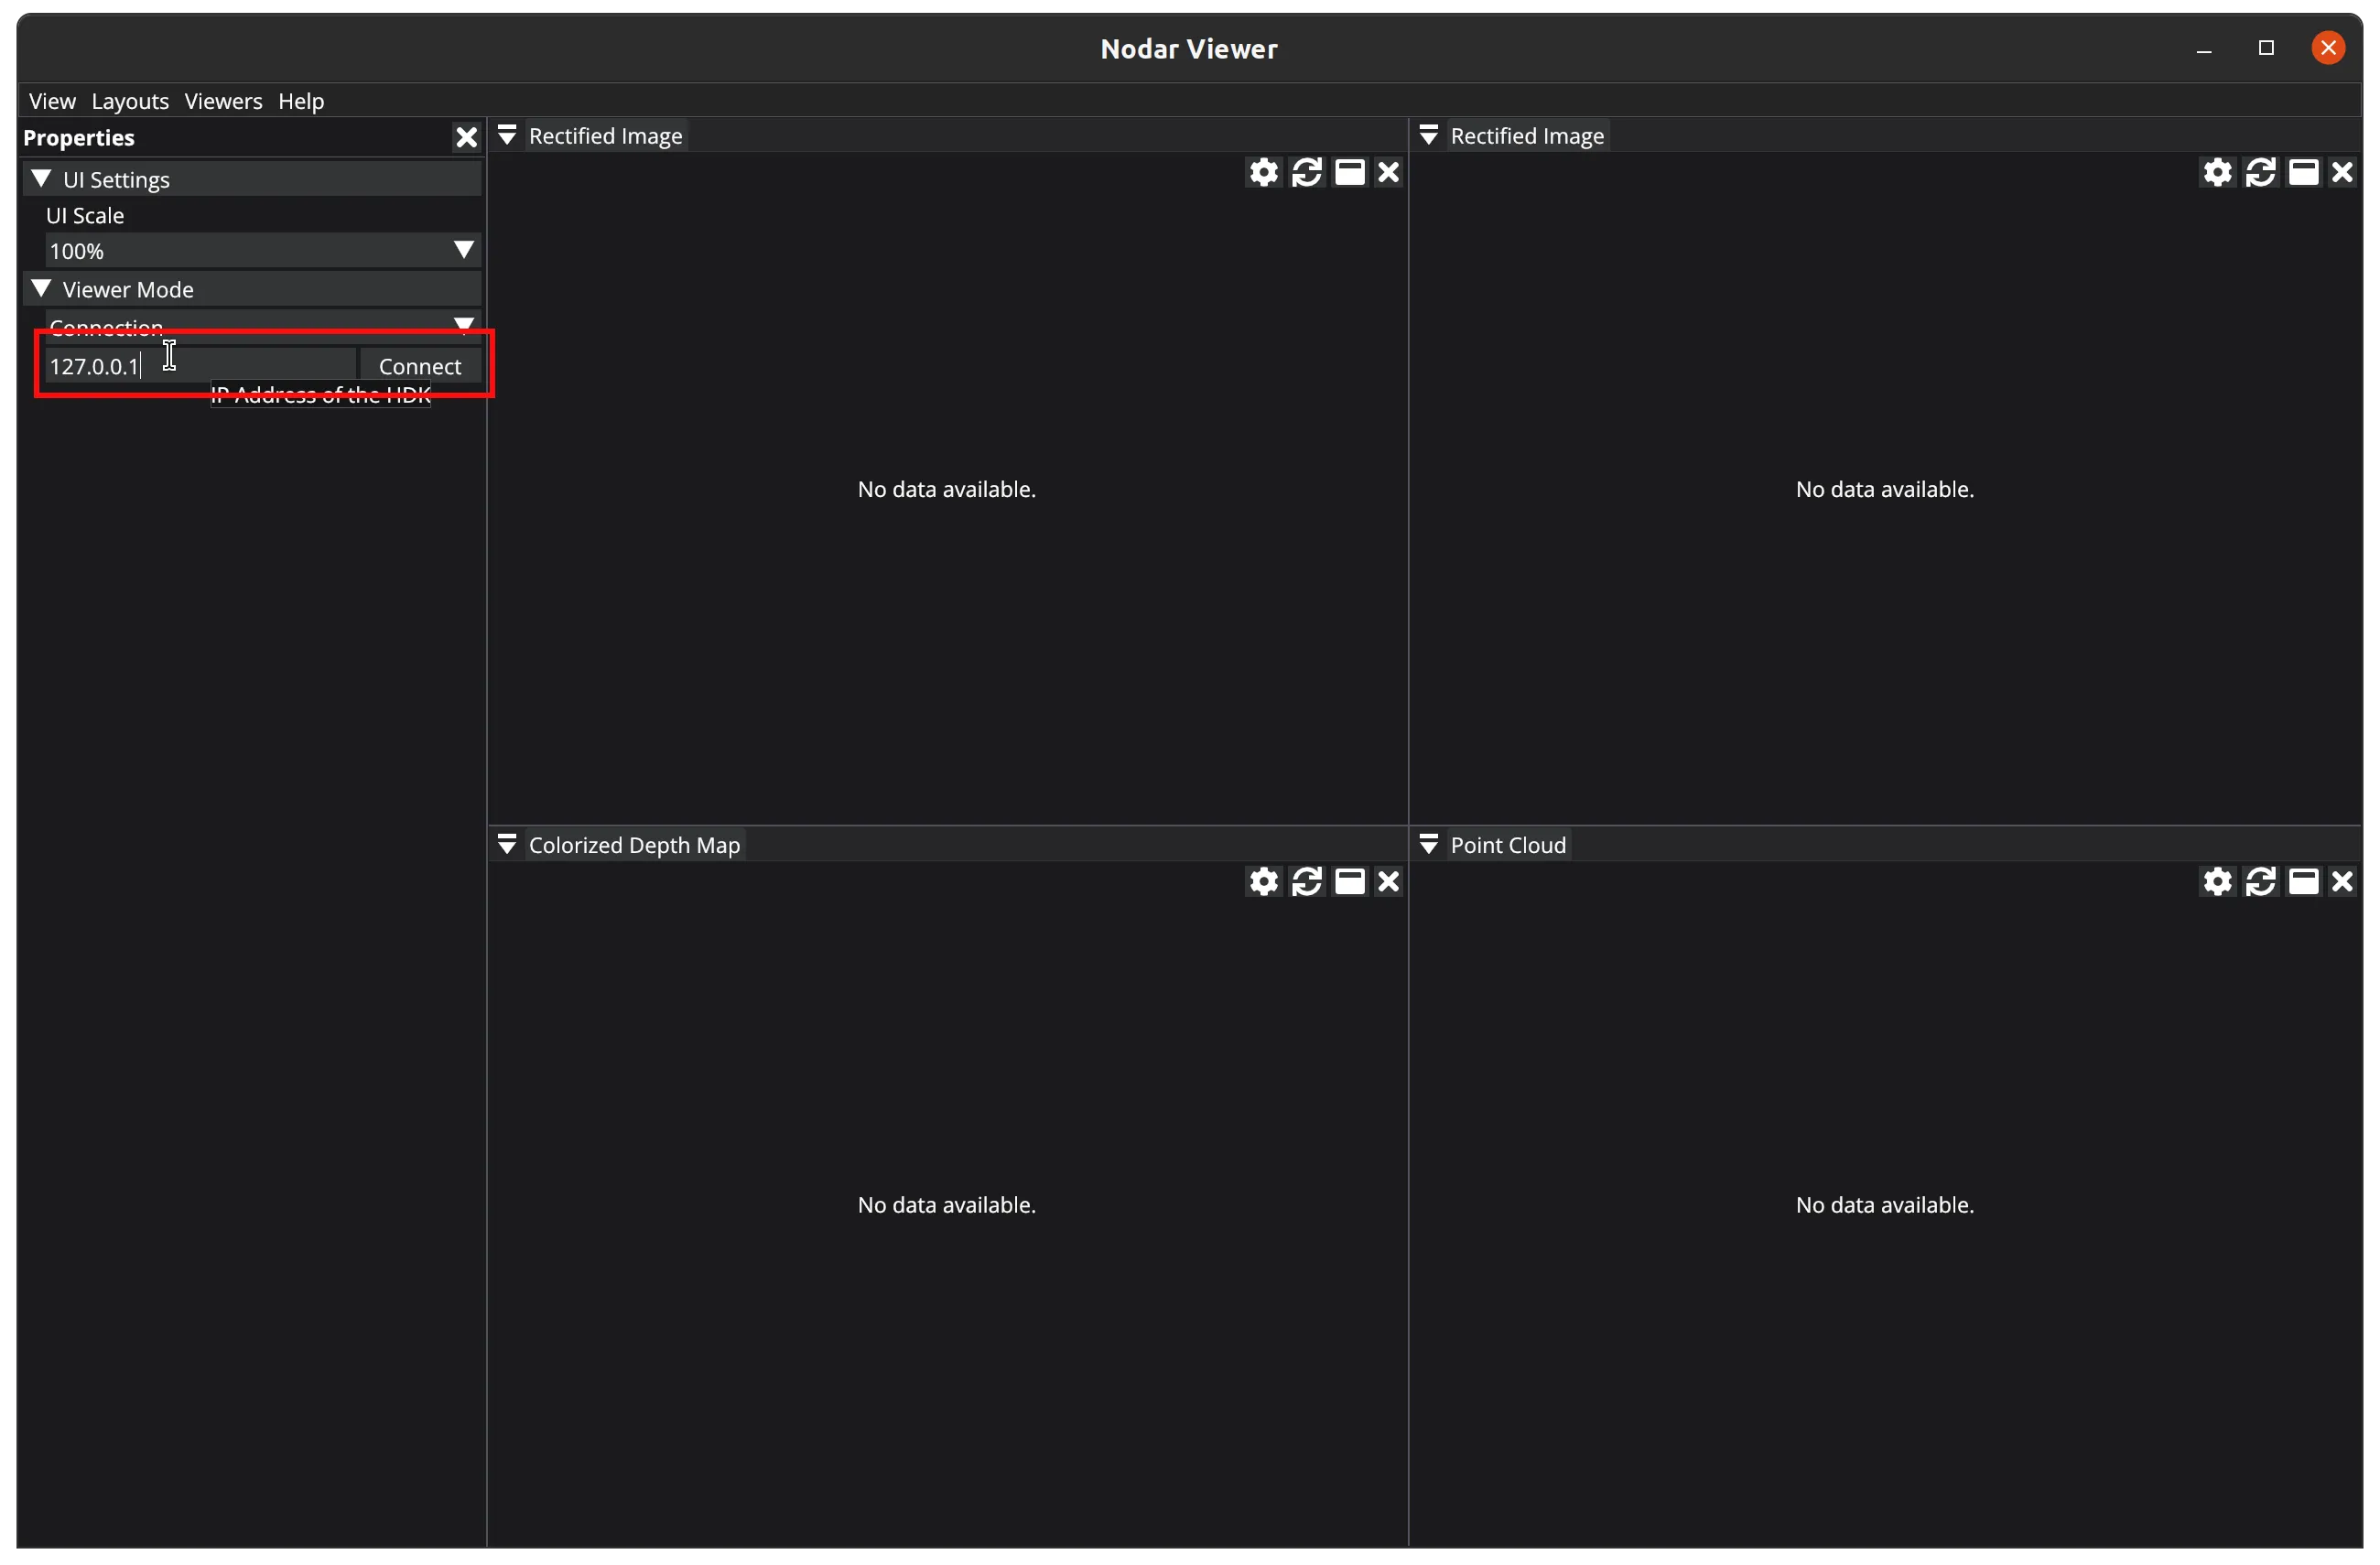
Connection Viewer Mode
When you select Connection from the mode drop-down list, you can connect to a remotely running Hammerhead. If you're running Hammerhead and NODAR Viewer on the same computer (laptop or NVIDIA Orin), you can use the default local host address 127.0.0.1.
If Hammerhead and NODAR Viewer are running on different computers, you need to connect them either through a physical cable, network, or Wi-Fi connection. You'll need to know the IP address of the machine running Hammerhead.
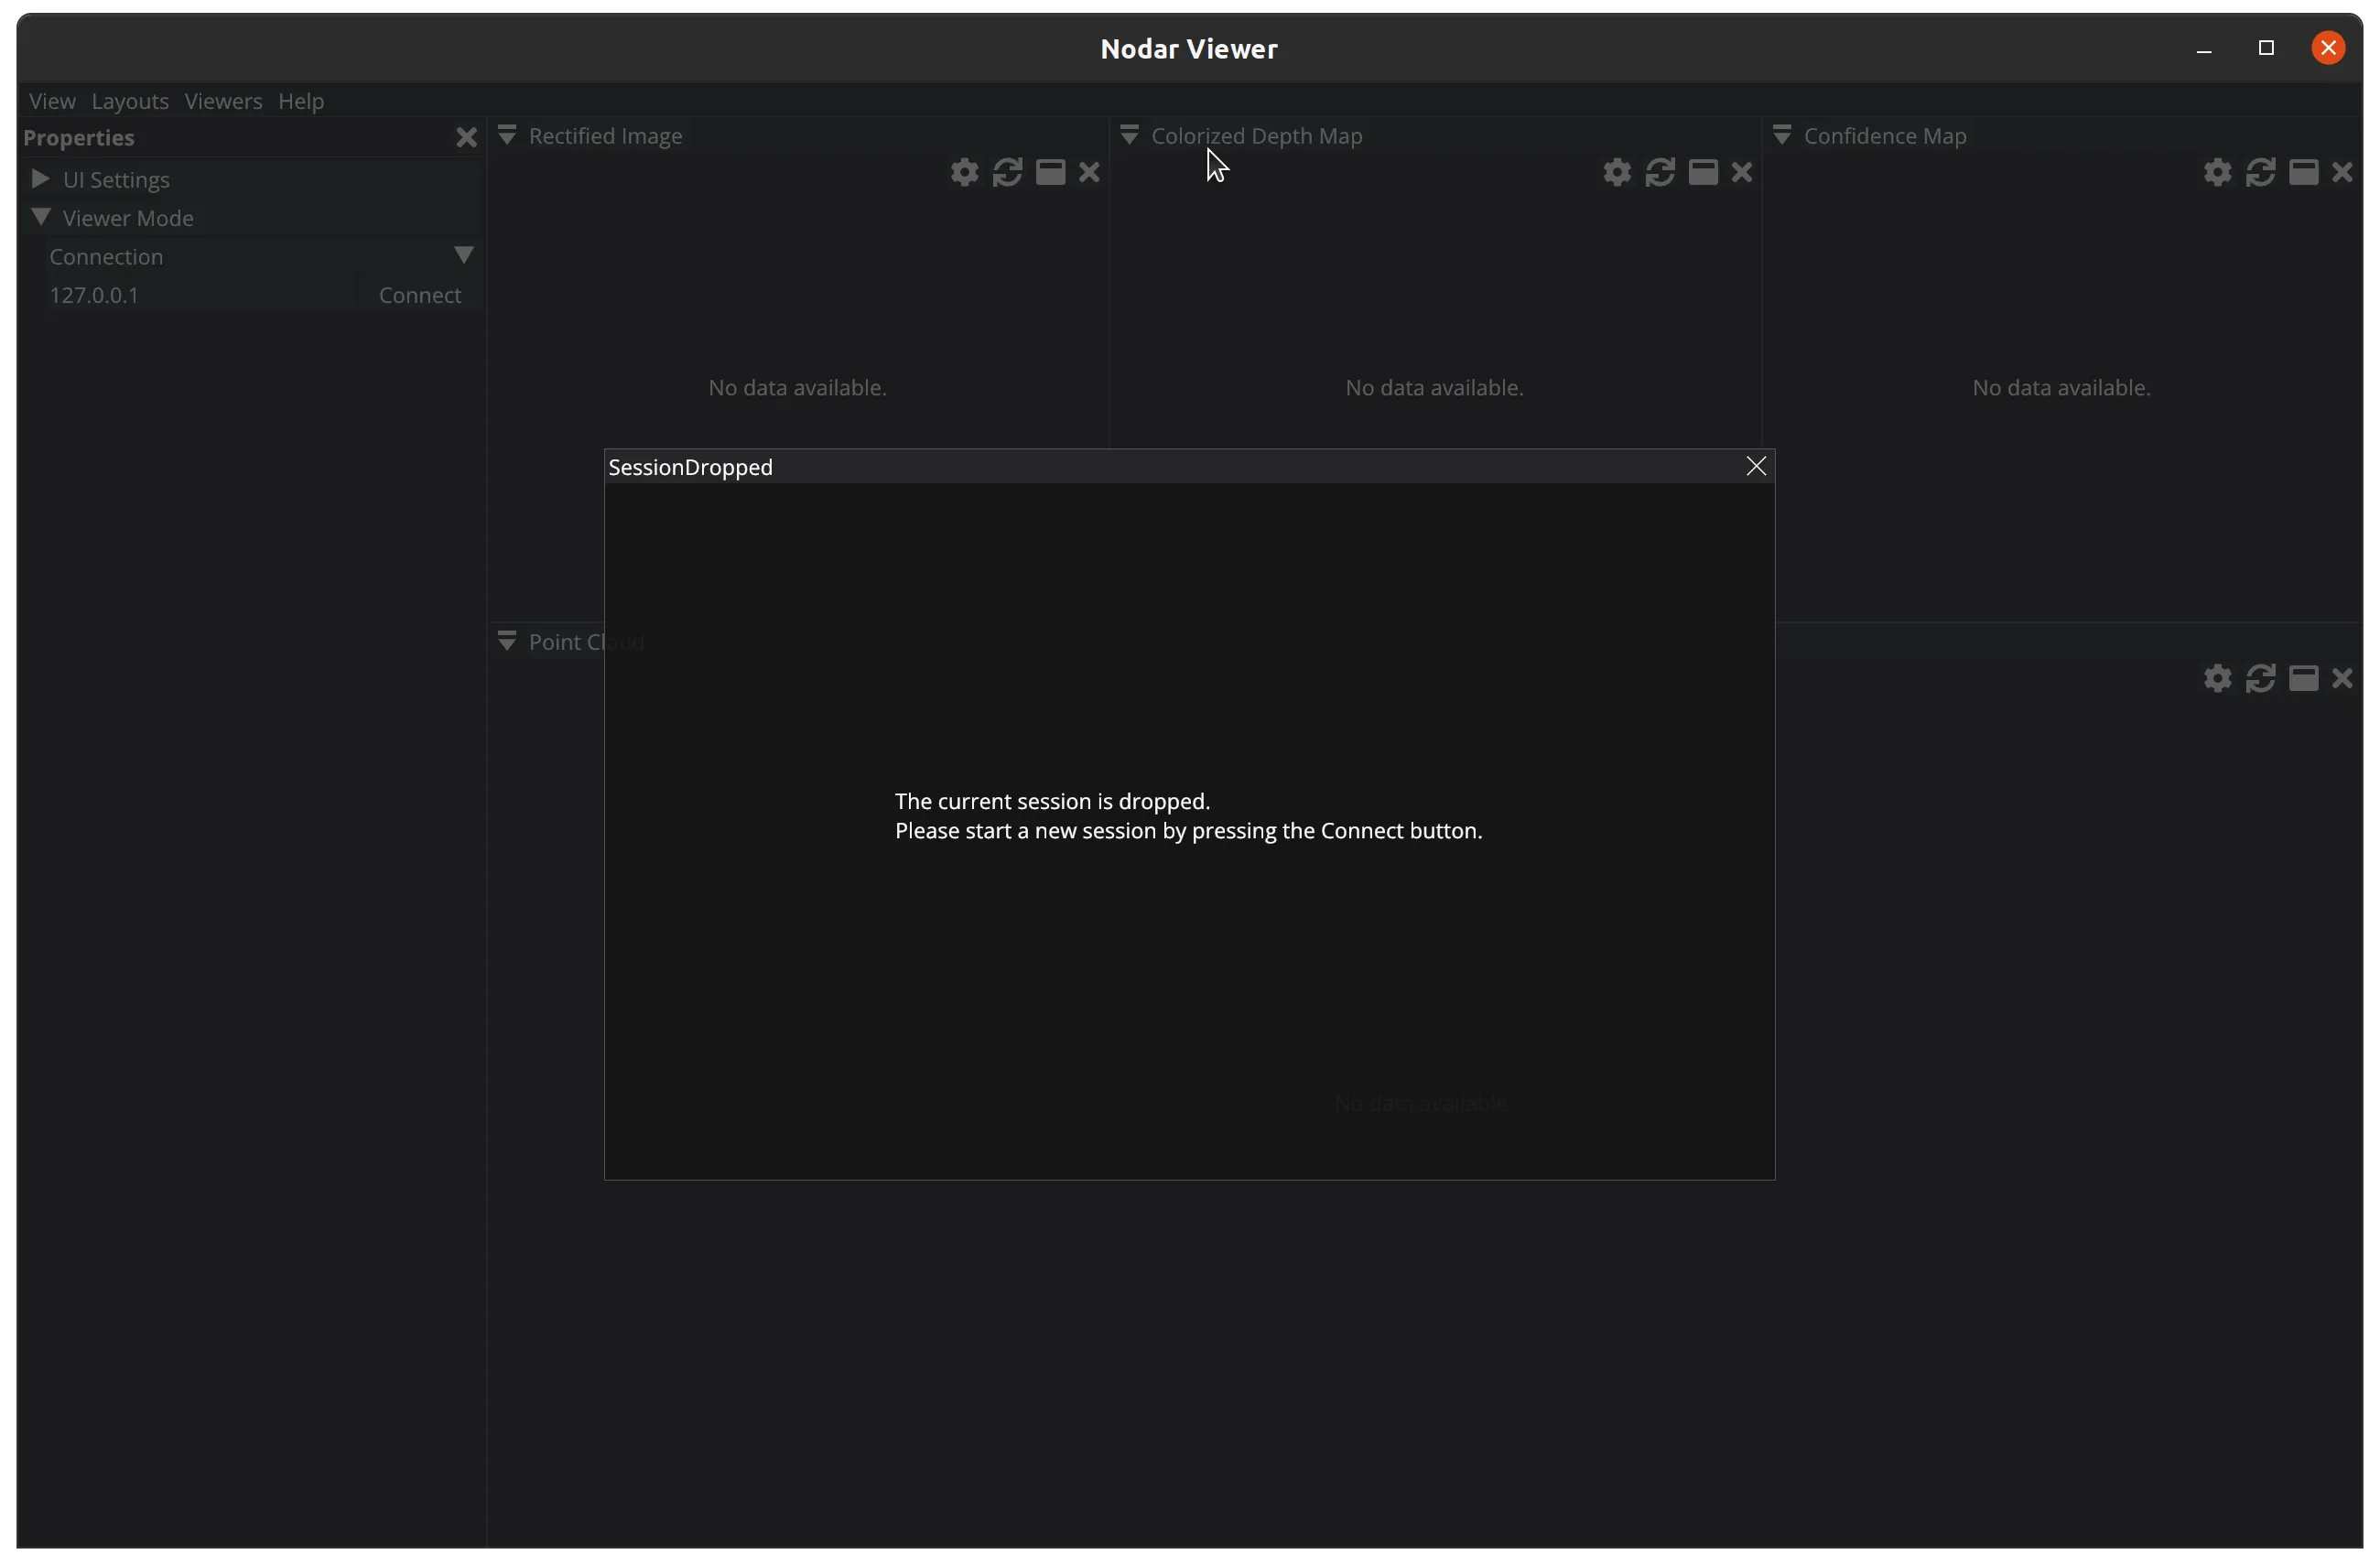
If Hammerhead exits during a connection, the viewer will automatically drop the connection session after a brief timeout.
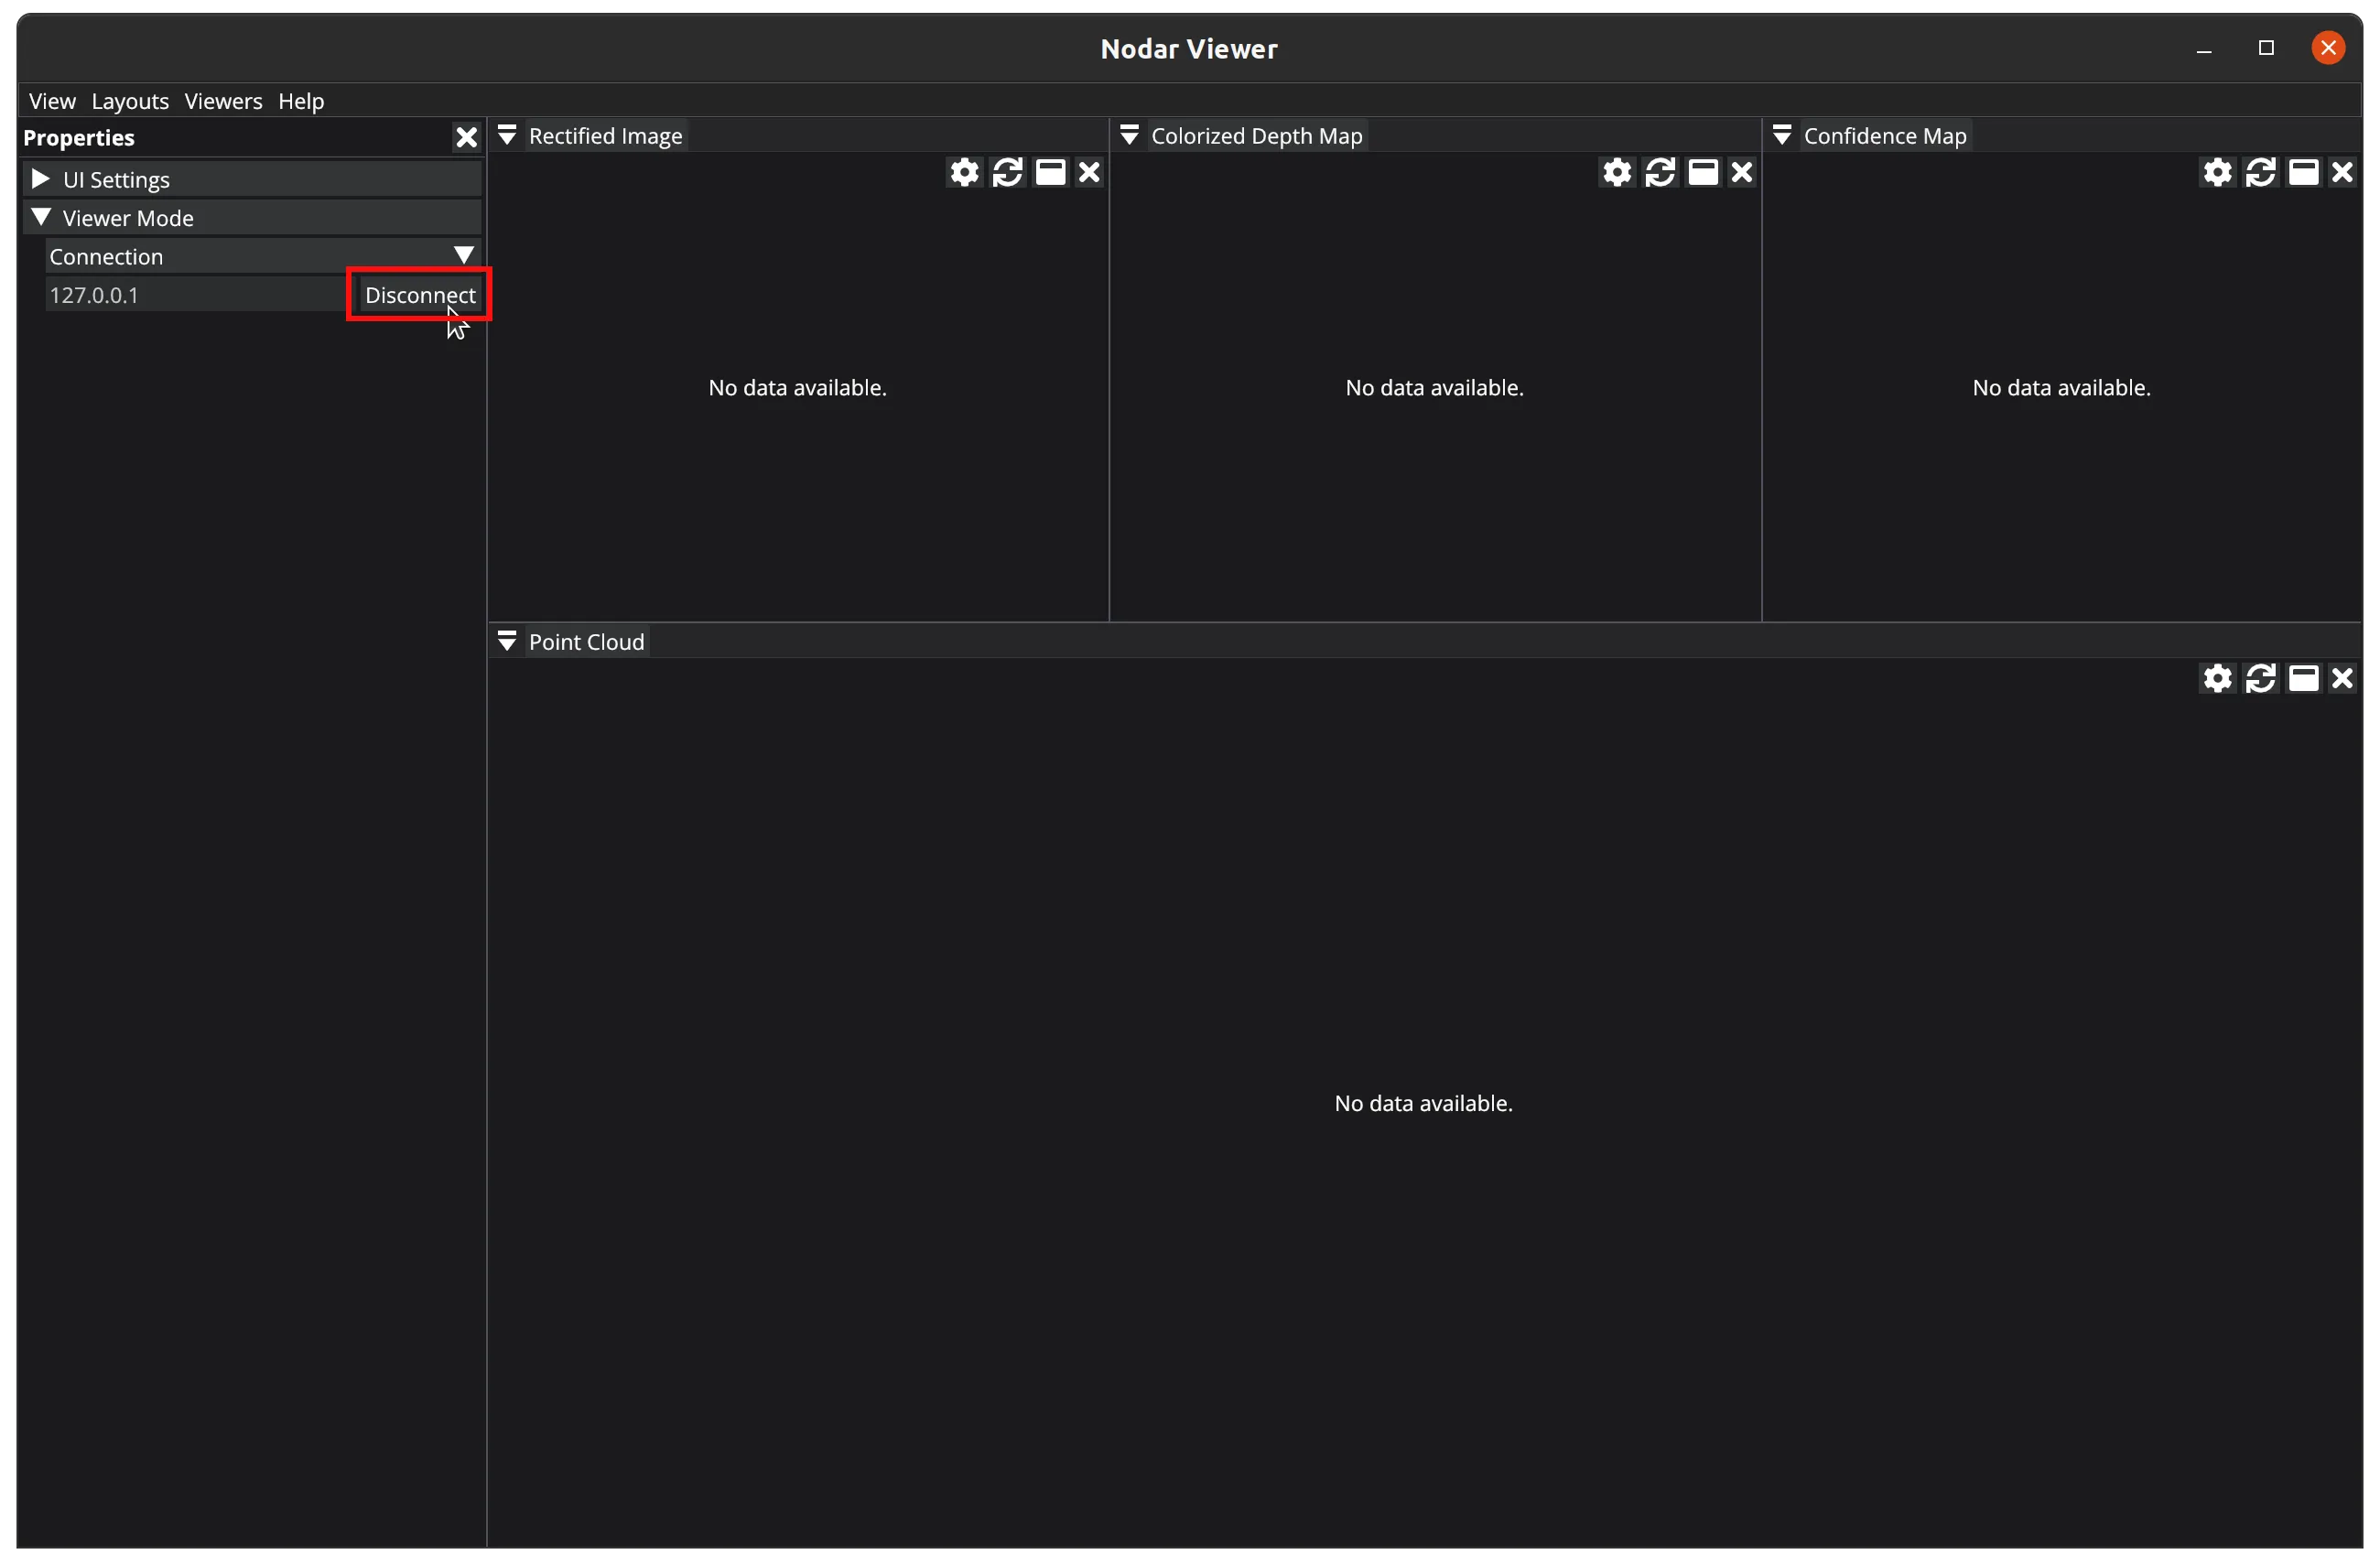
To manually end the connection, click the Disconnect button.
Note
The Hammerhead and Viewer versions must match, as they are not backward compatible. If the versions differ, the connection will drop displaying an error message.
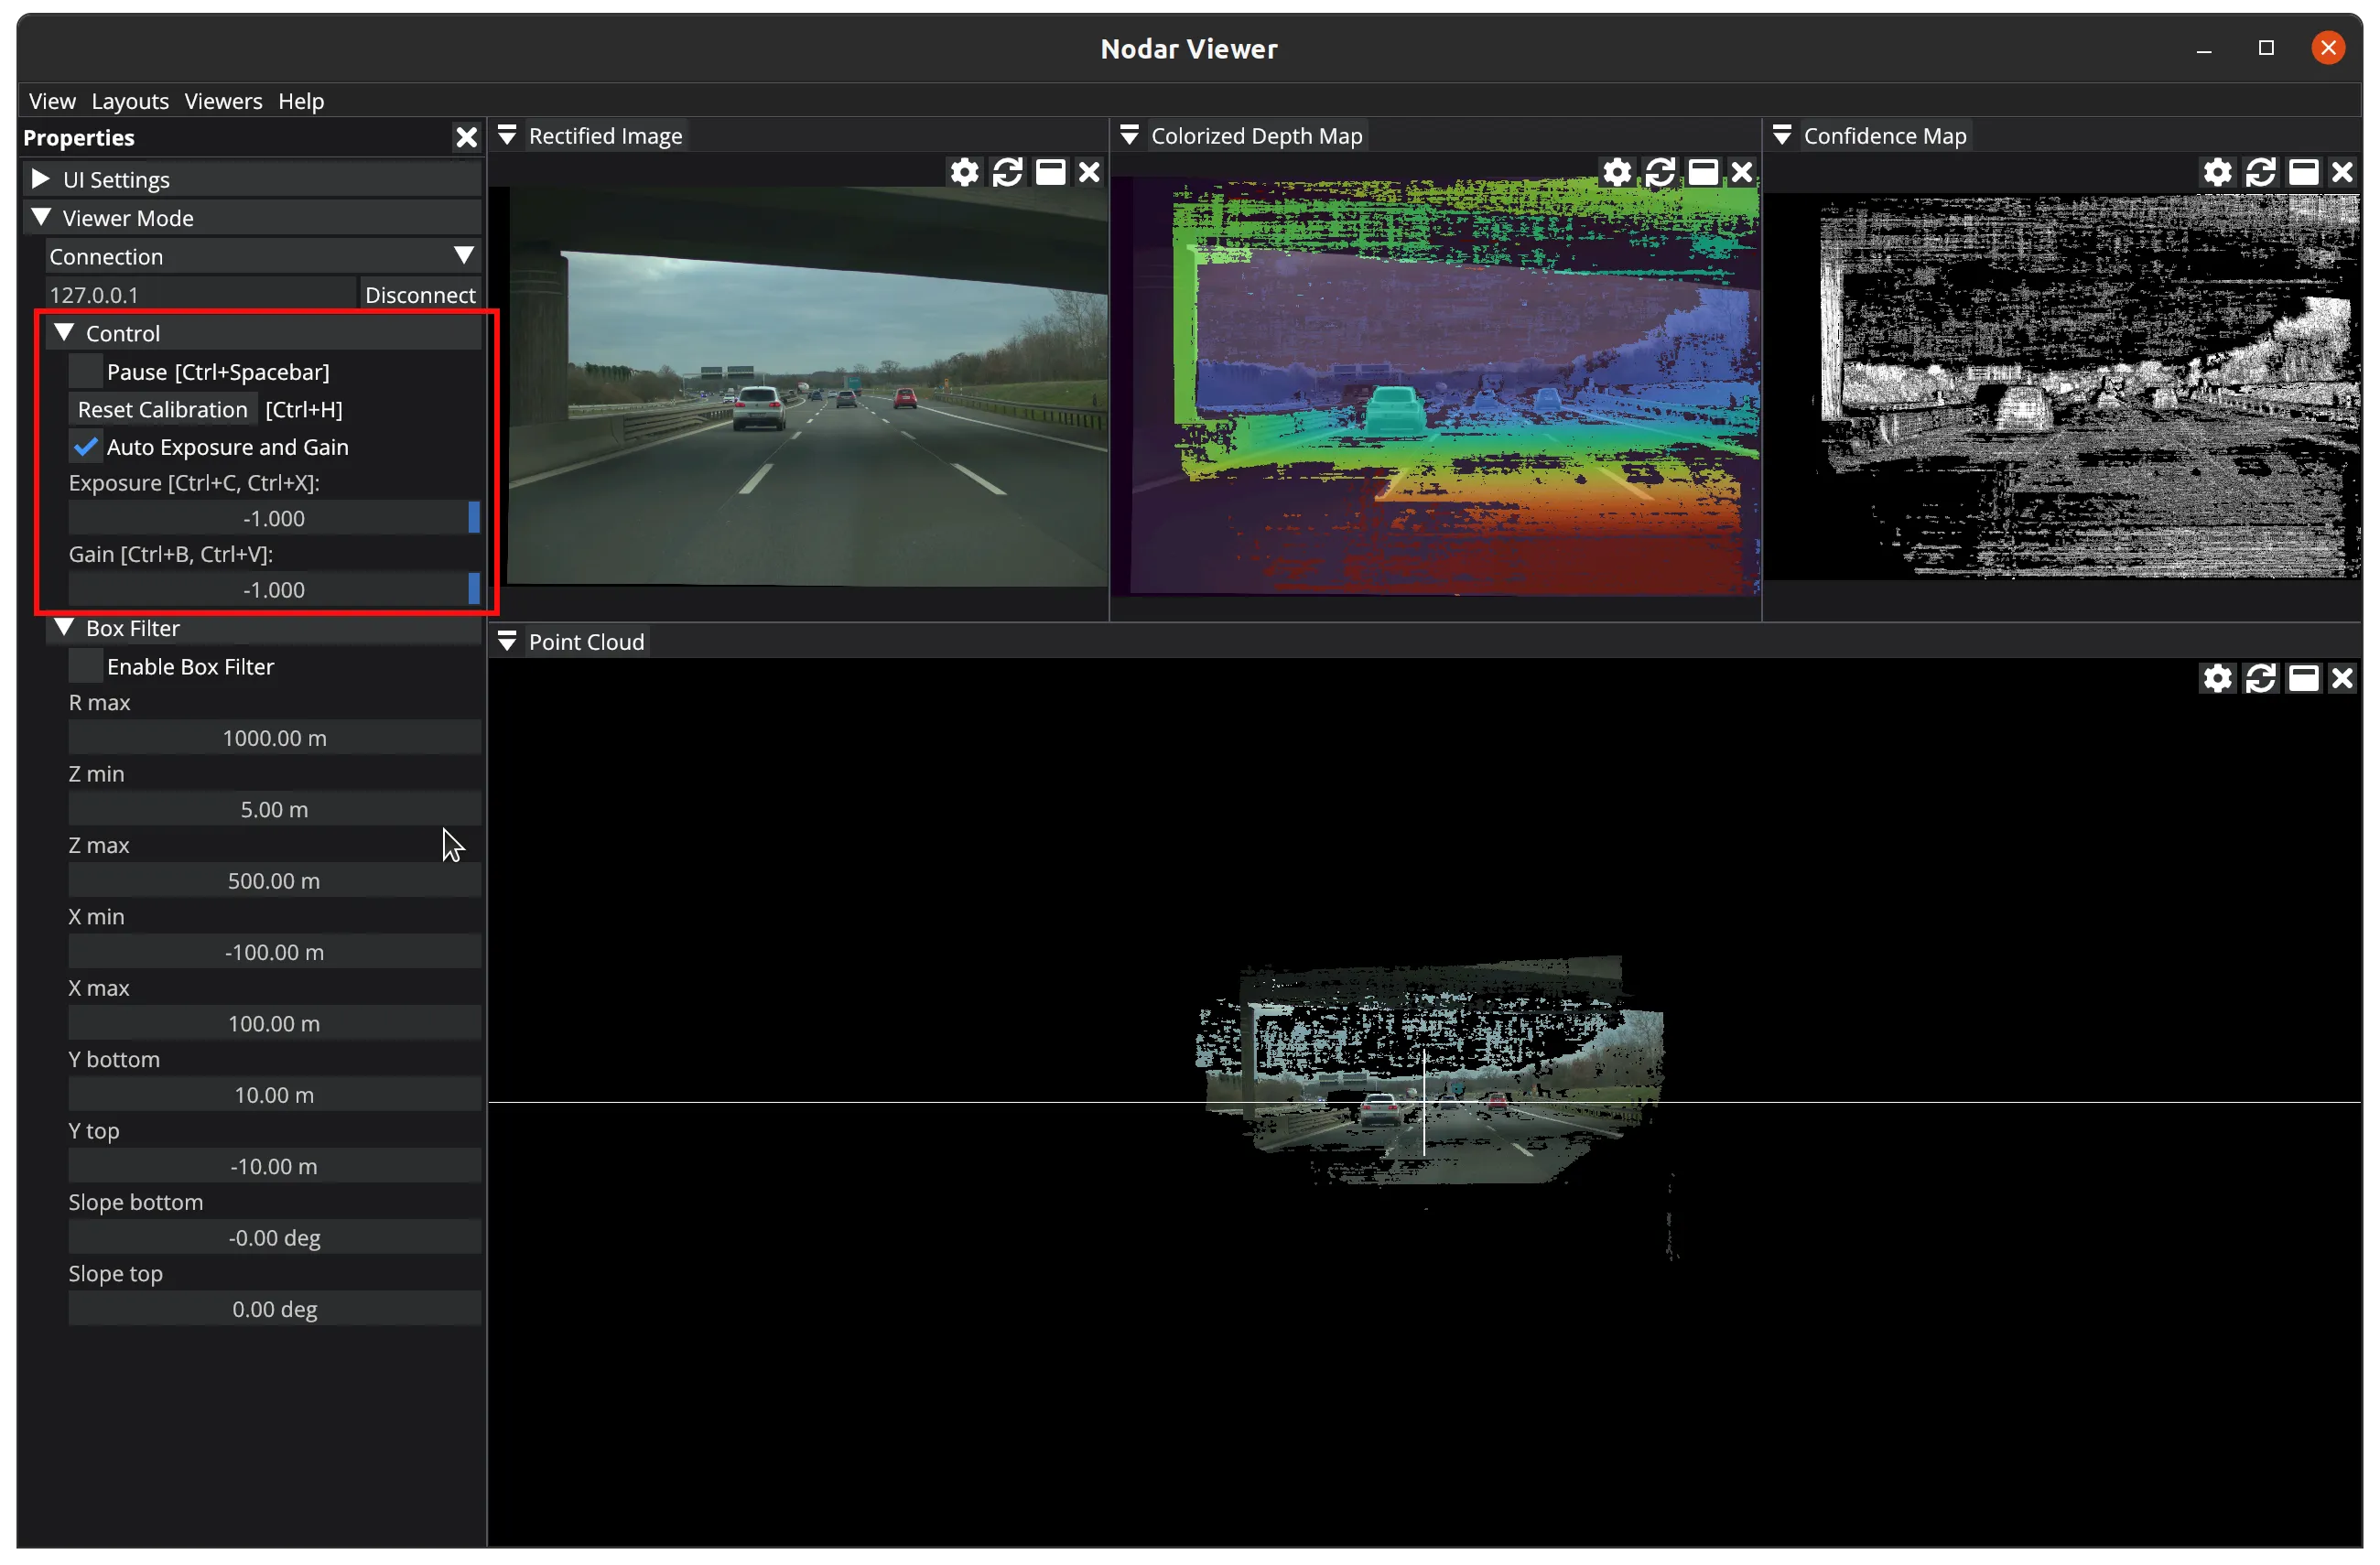
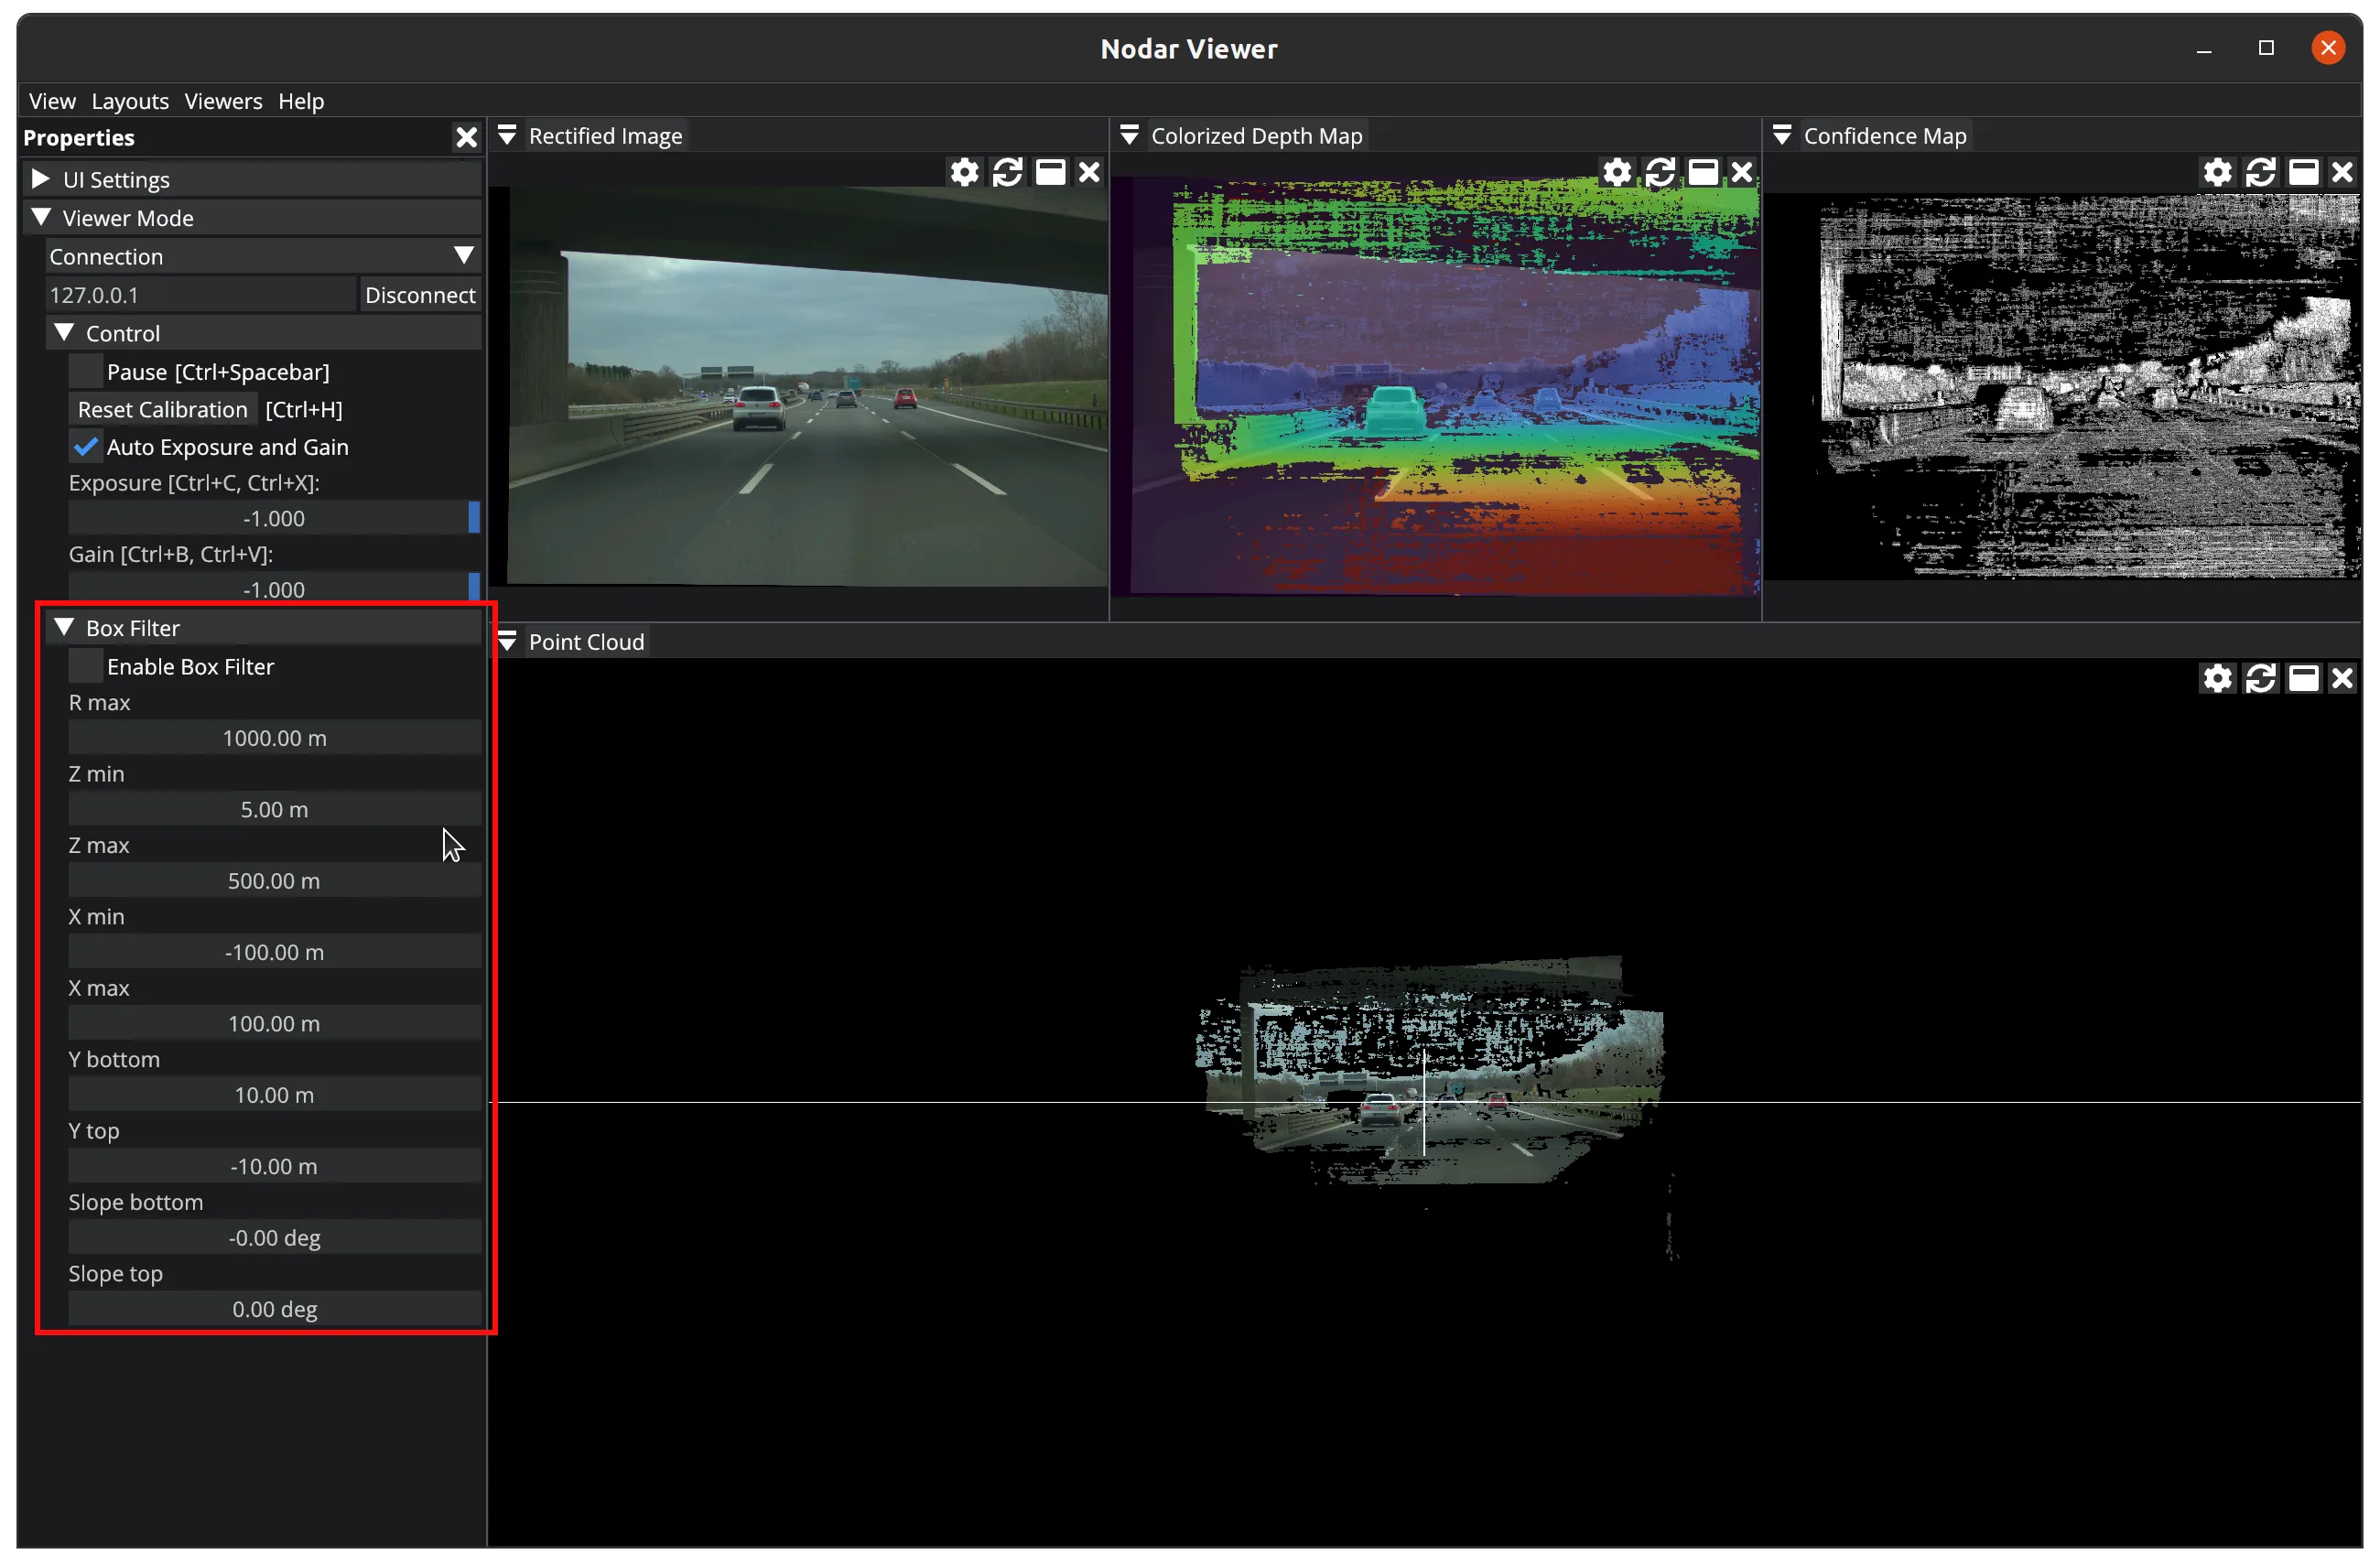
When successfully connected, a new UI appears that lets you control various Hammerhead properties.
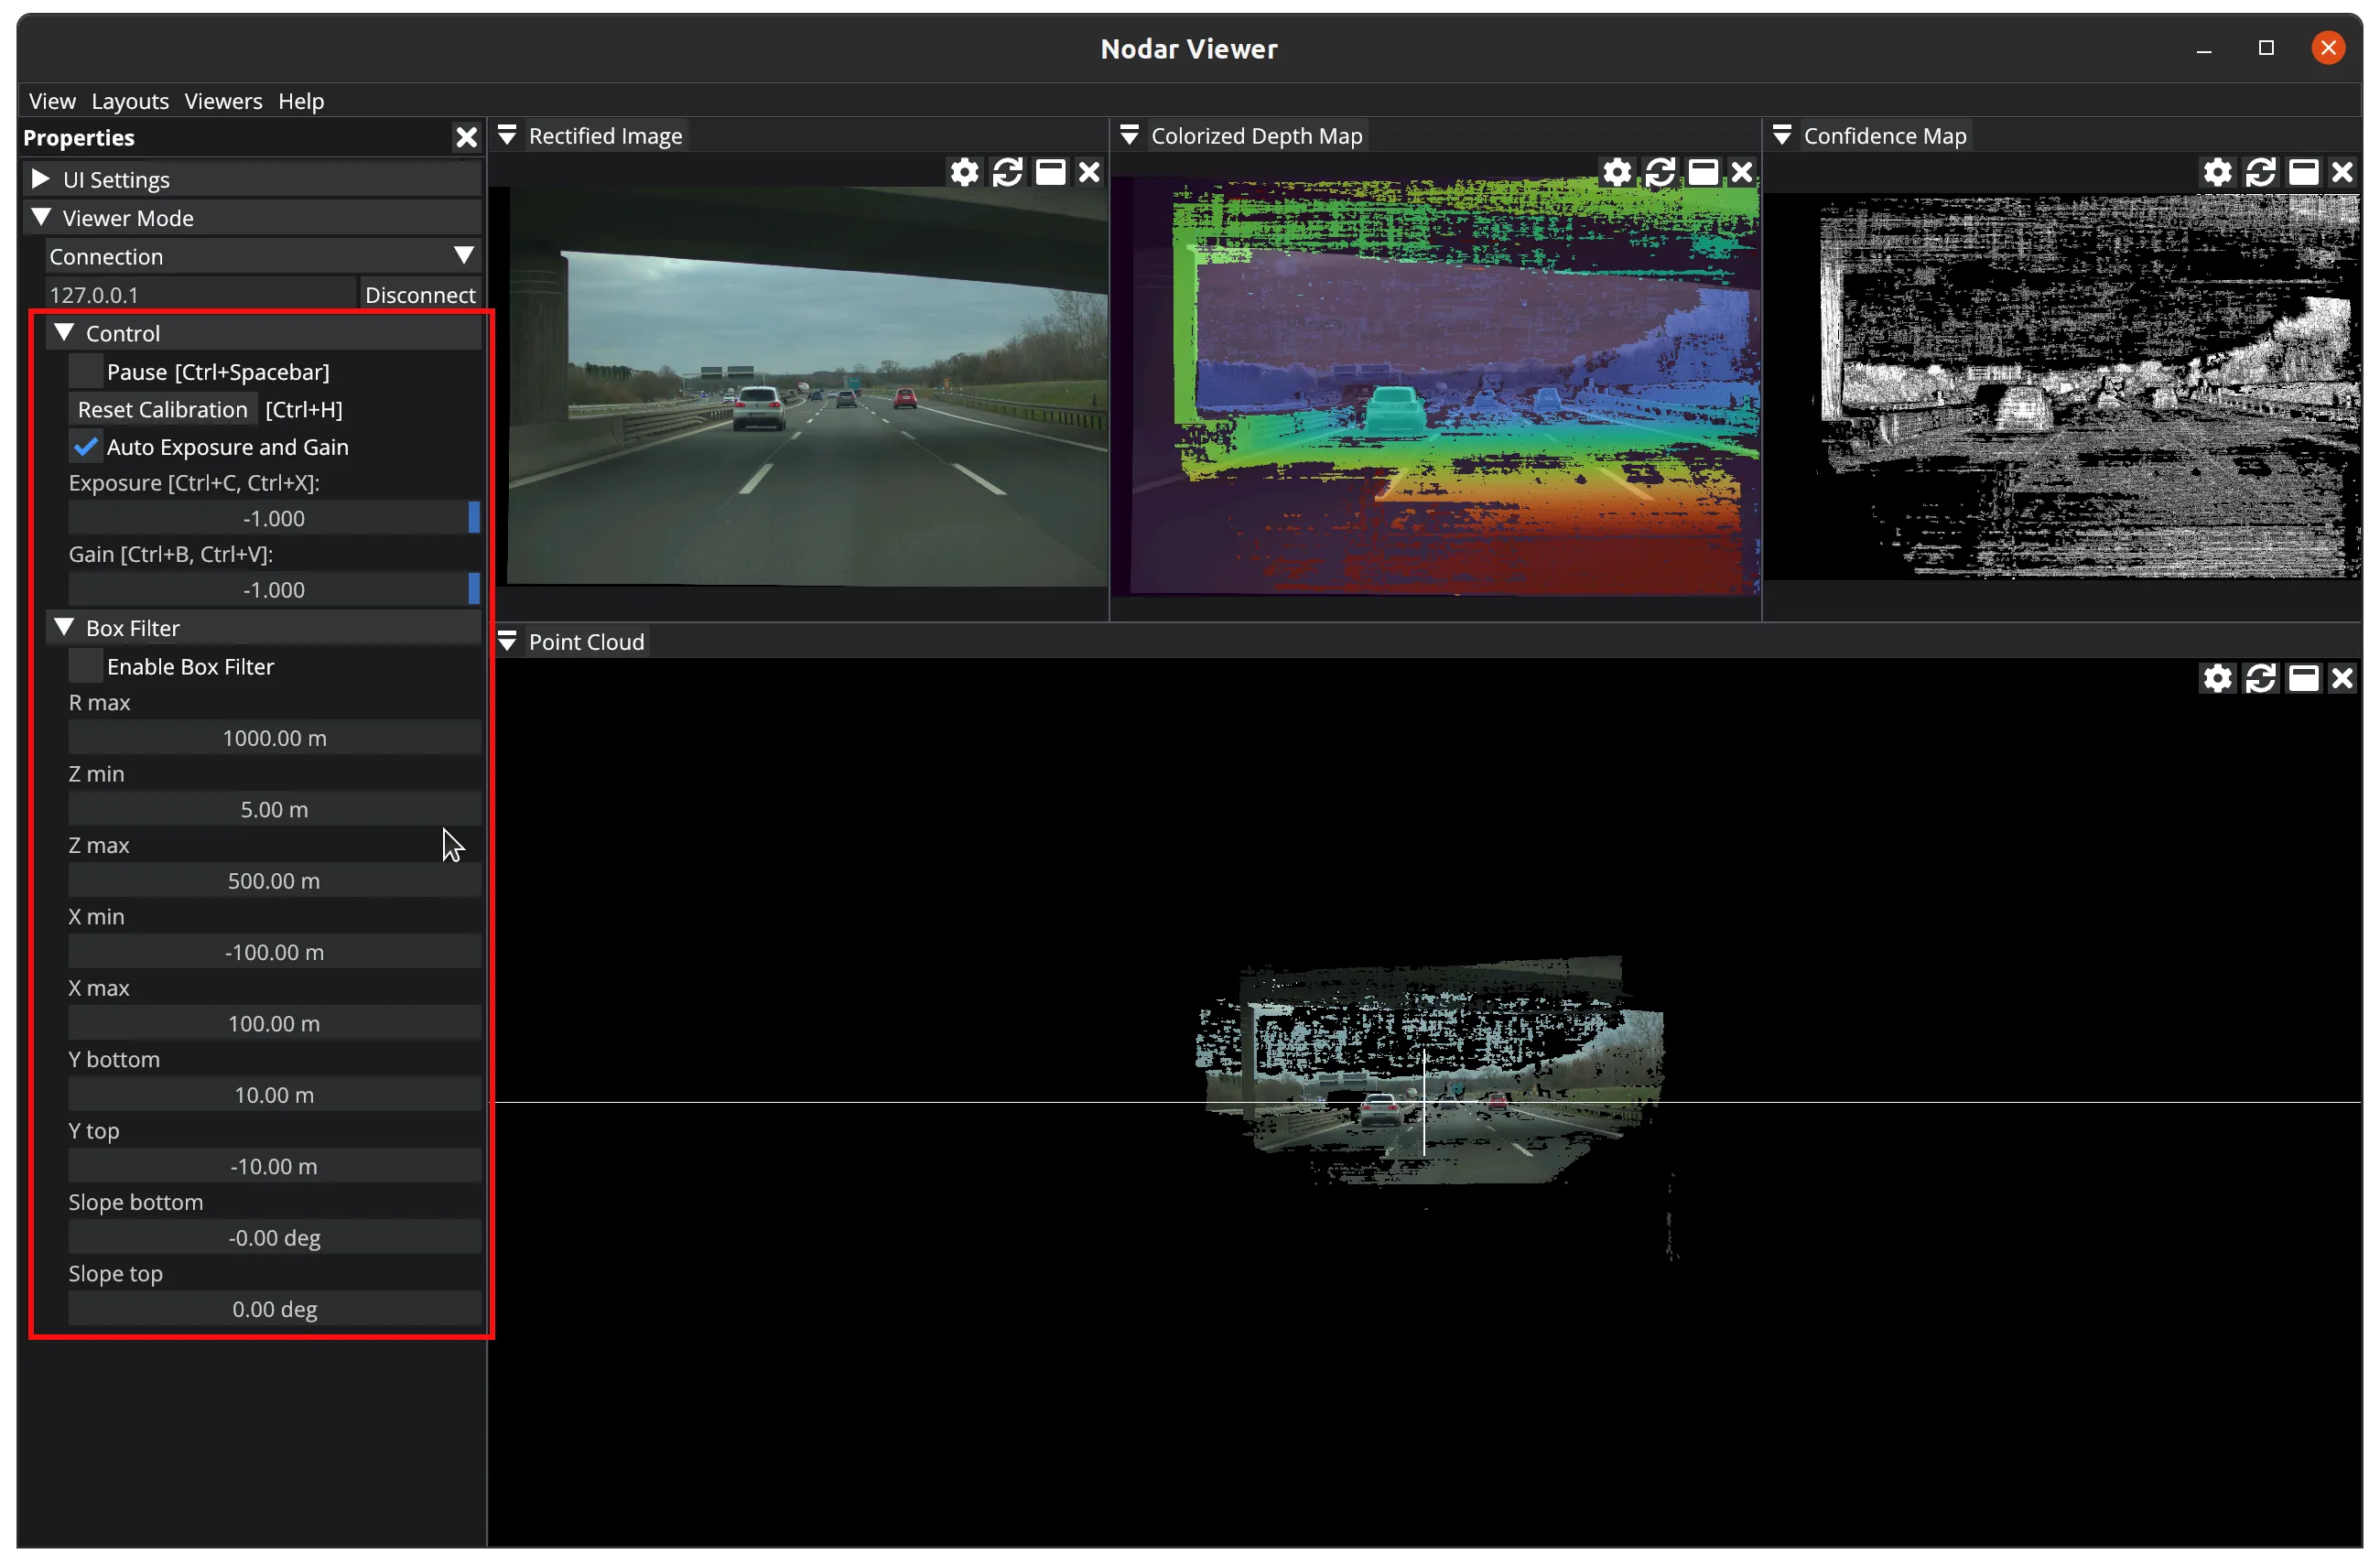
Control
In the Control section, you can:
- Pause and resume
Hammerhead - Reset calibration (returns calibration parameters to their default state)
- Enable auto exposure and gain
- Manually control exposure and gain
Box Filter
In the Box Filter section, you can enable and configure box filter settings.
Playback Viewer Mode
When you select Playback from the mode drop-down list, you can replay saved data. You can either manually type the path to a data folder in the input field or use a file dialog to select the directory.
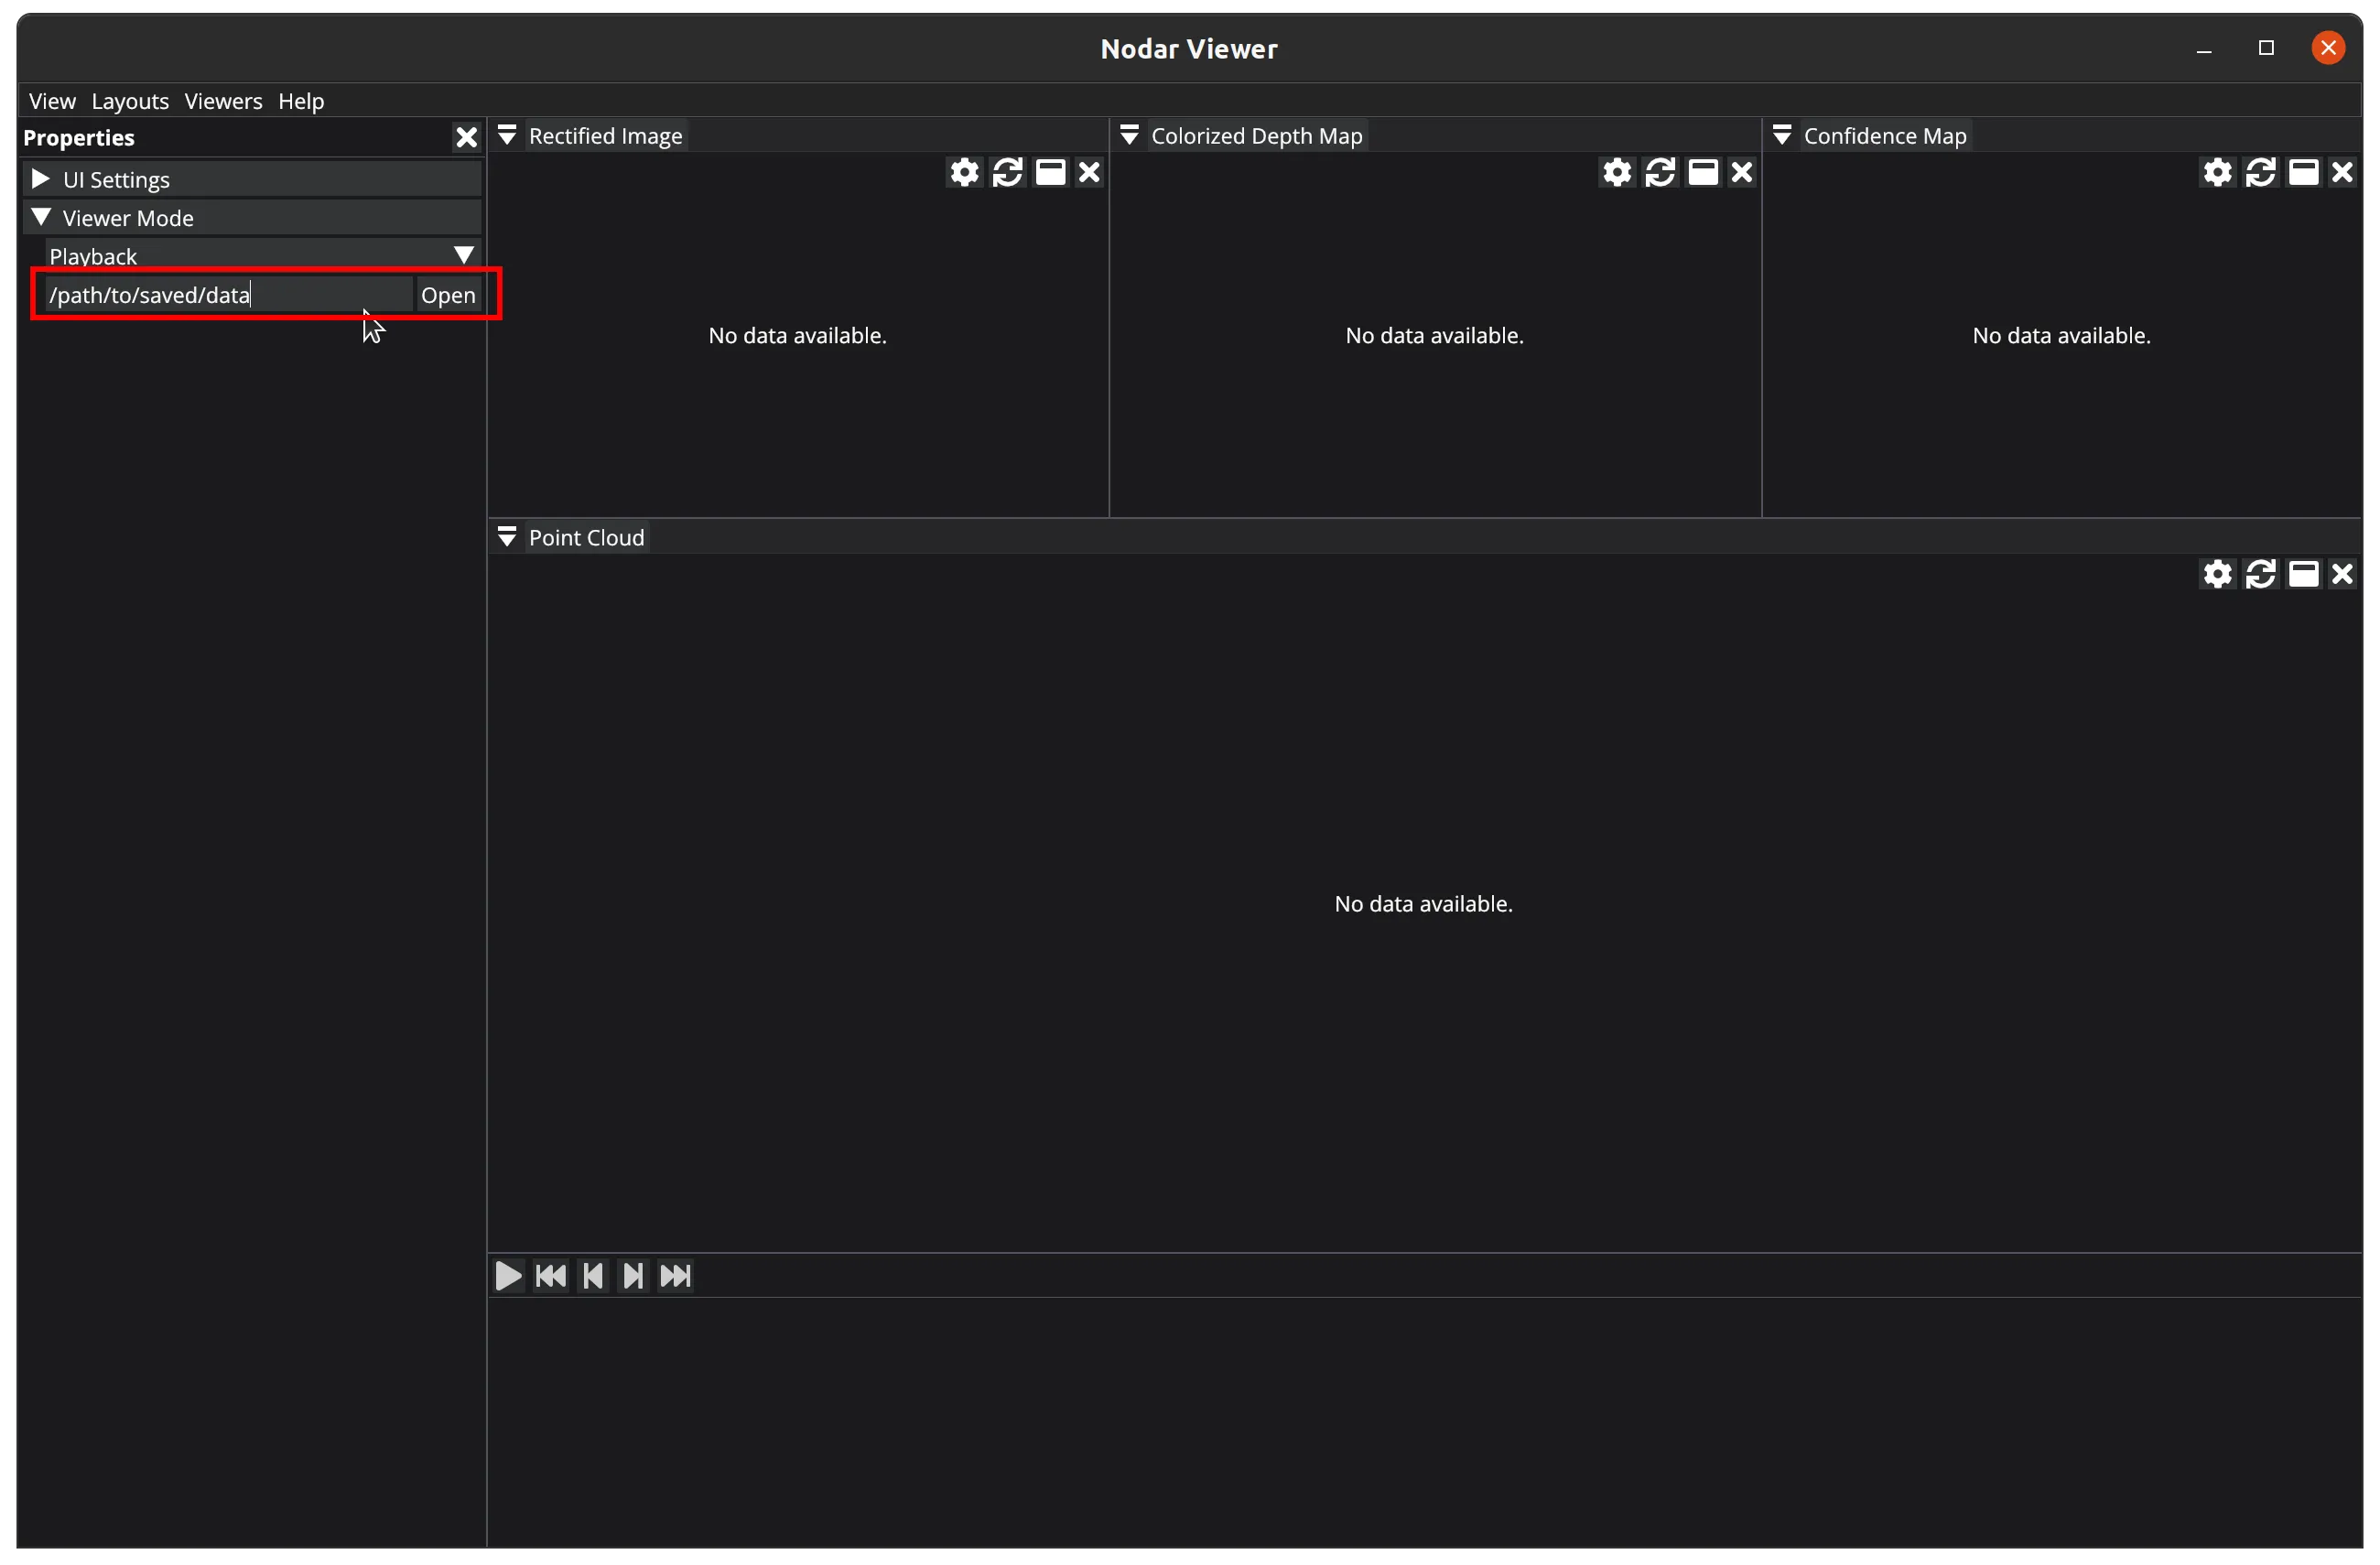
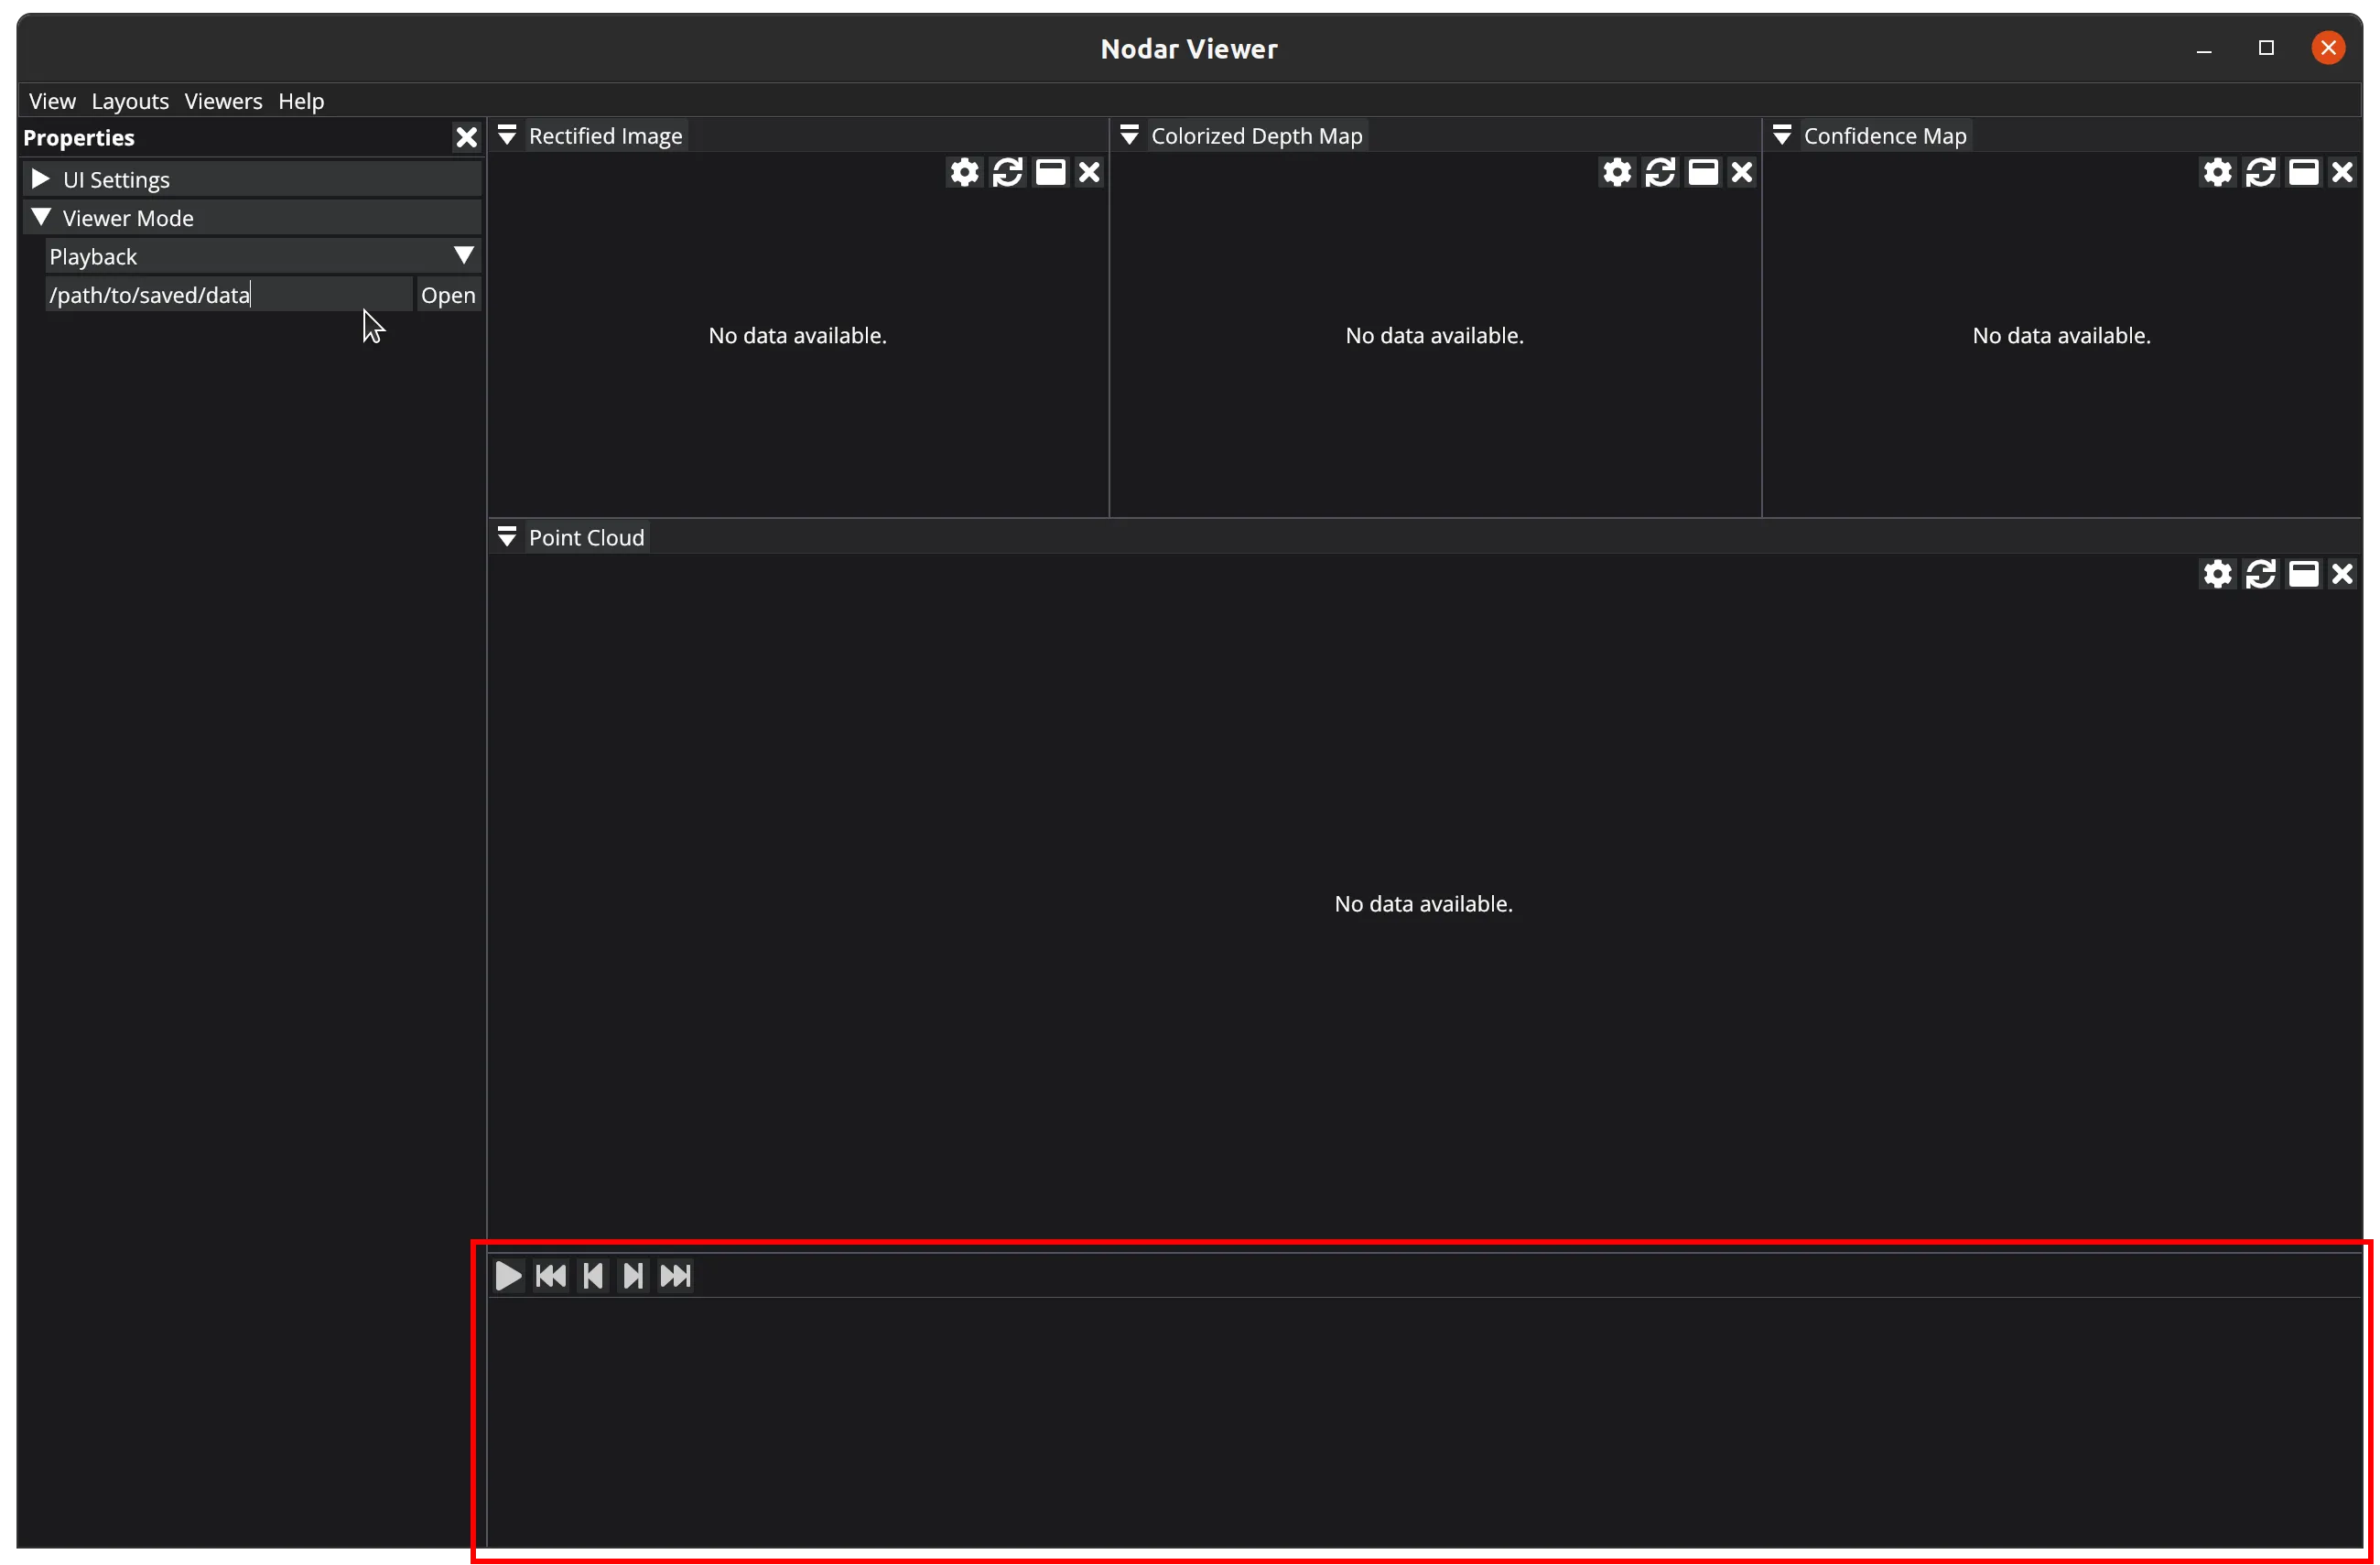
When you select Playback mode, the Timeline panel automatically opens at the bottom.
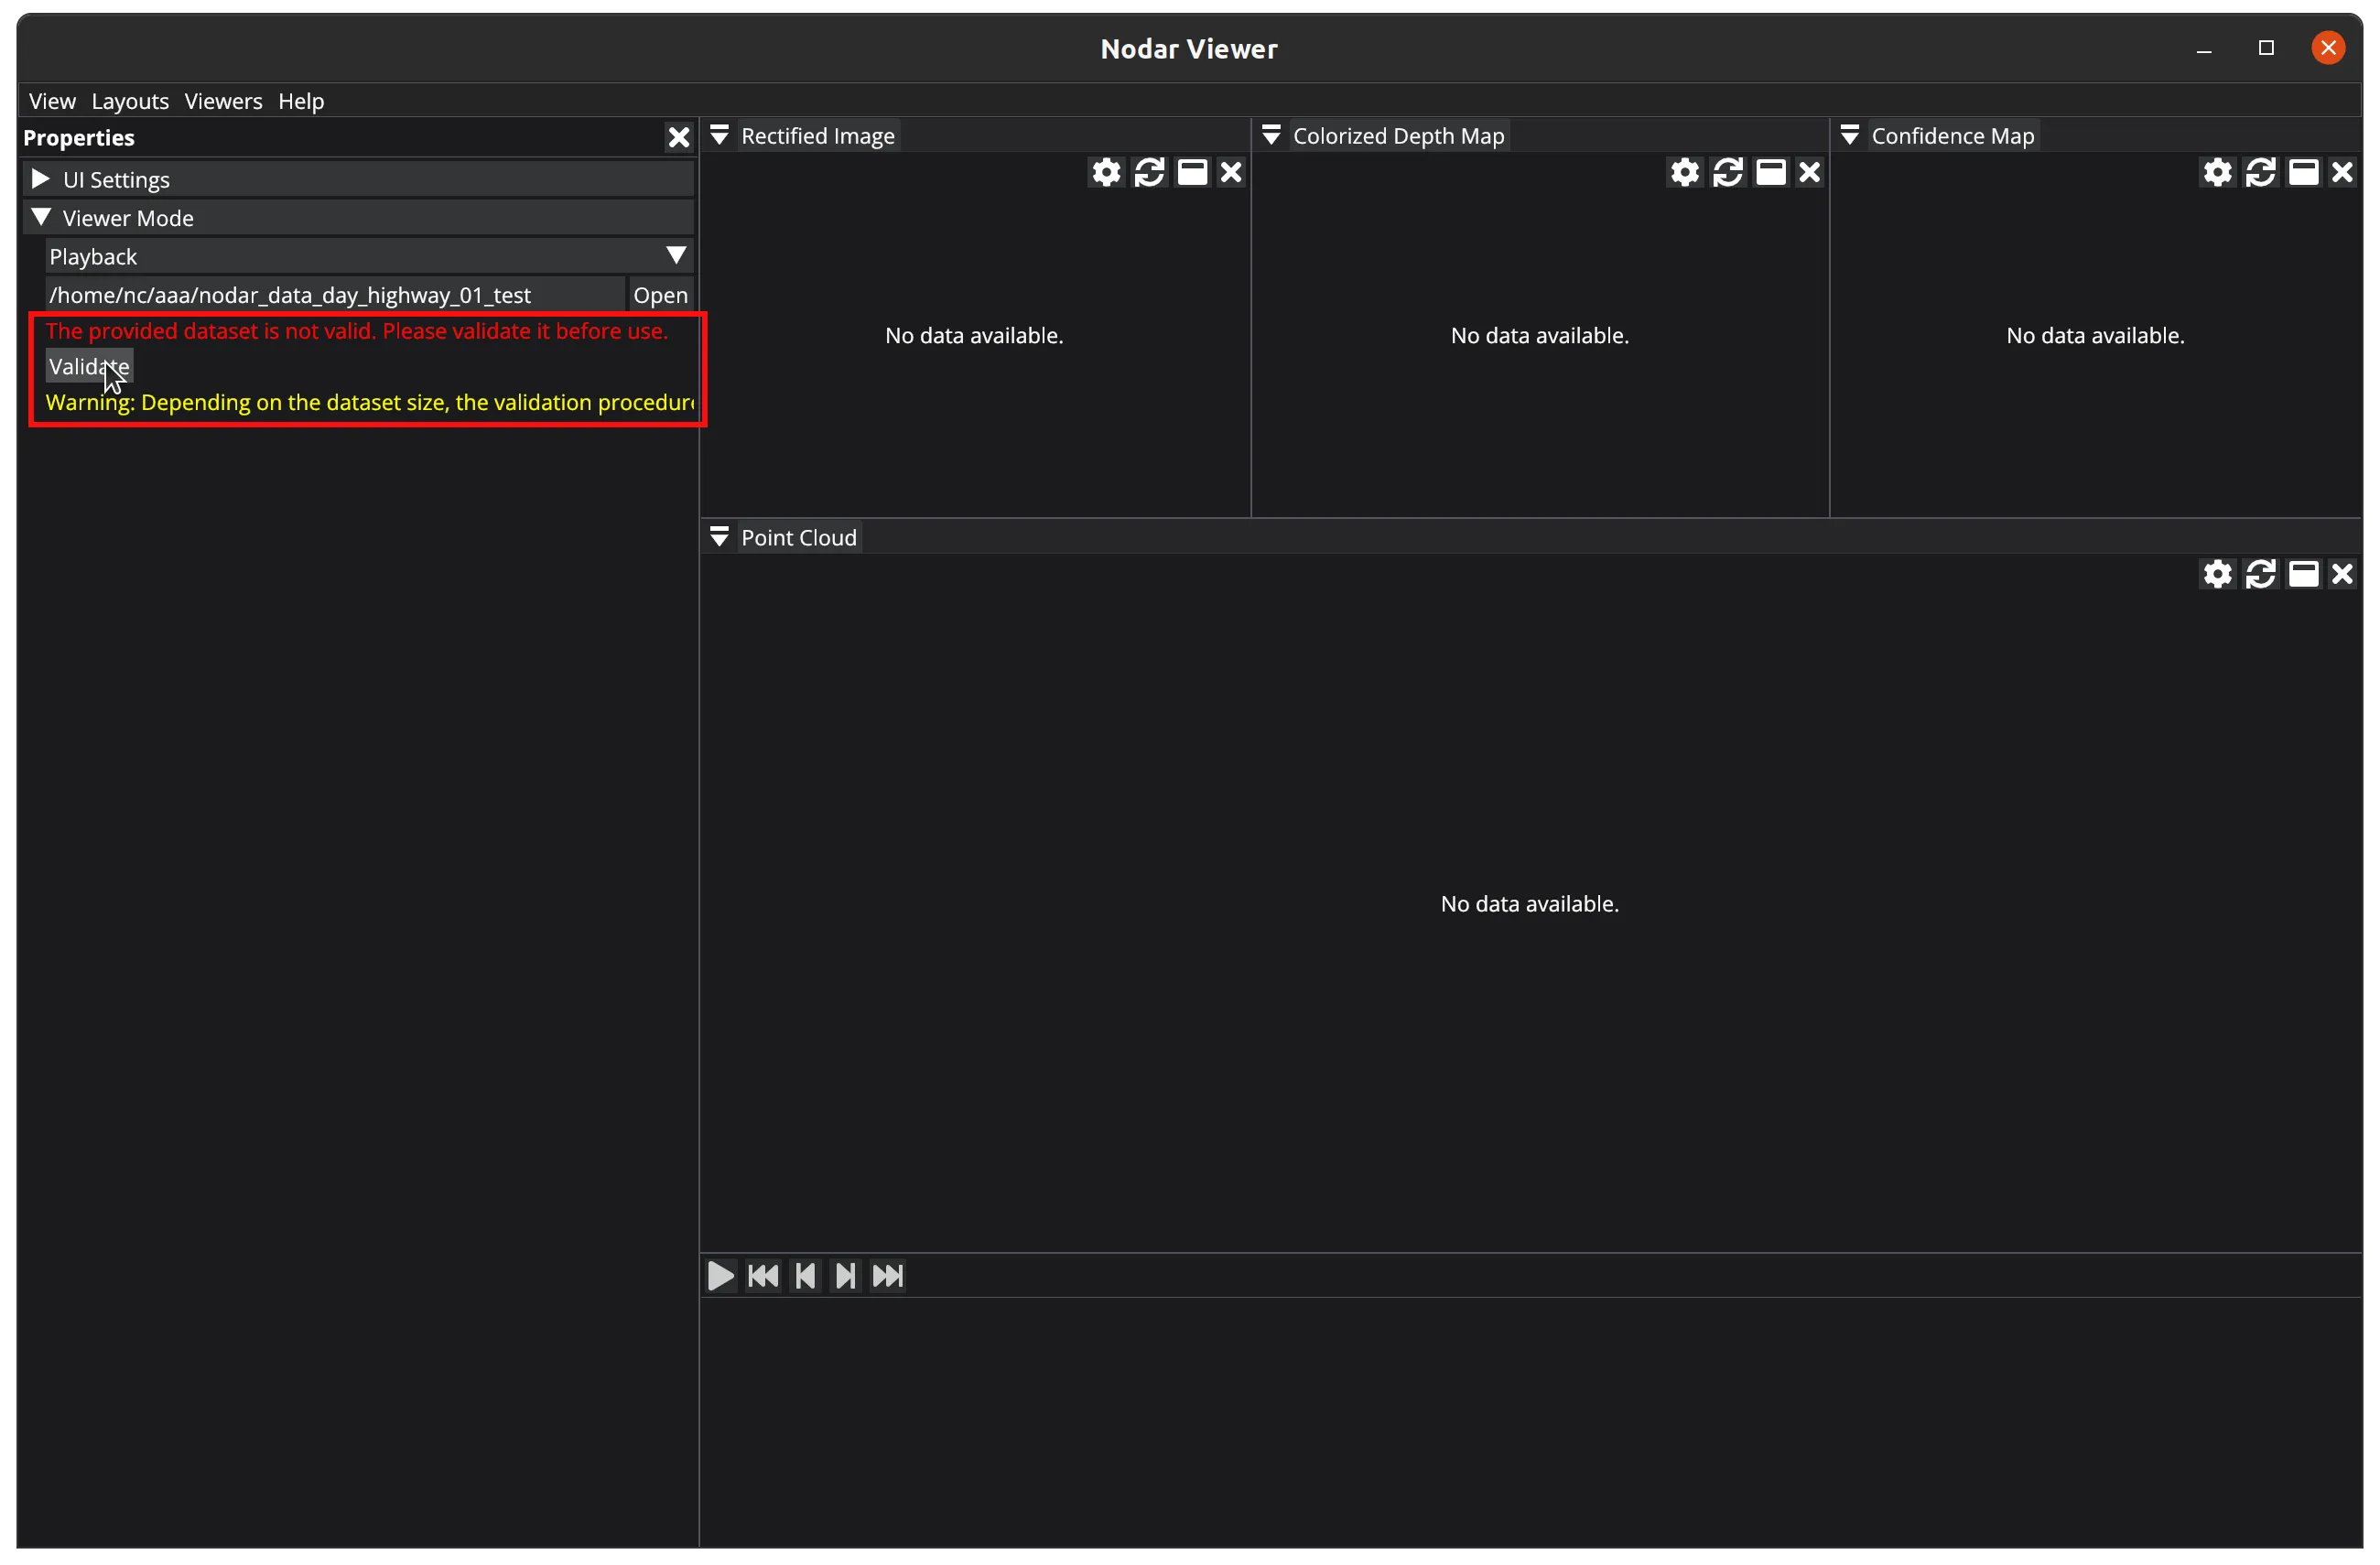
When opening a data folder, Viewer performs data source validity checks and reports any data saved in incorrect formats. It suggests converting the data to the correct format by clicking the Validate button.
The validation process may take some time, depending on the size of your data. When finished, any incorrectly formatted data will be replaced with properly formatted versions.
Navigate through the data source by selecting a frame on the frame line or by using the timeline controls:
Play/Pause— starts or stops the playbackMove to start— jumps to the first frameMove one frame back— moves to the previous frameMove one frame forward— moves to the next frameMove to end— jumps to the last frame
Viewers
Once Viewer is connected to Hammerhead or a data source is loaded for playback, you can open different viewers to examine the data.
Each viewer offers the following controls, from left to right:
Properties— opens a properties panel. Each viewer has its own properties (some viewers may have none).Turn into— transforms the viewer into a different type of viewer.Maximize— expands the viewer to occupy the full application window.Close— closes the viewer.
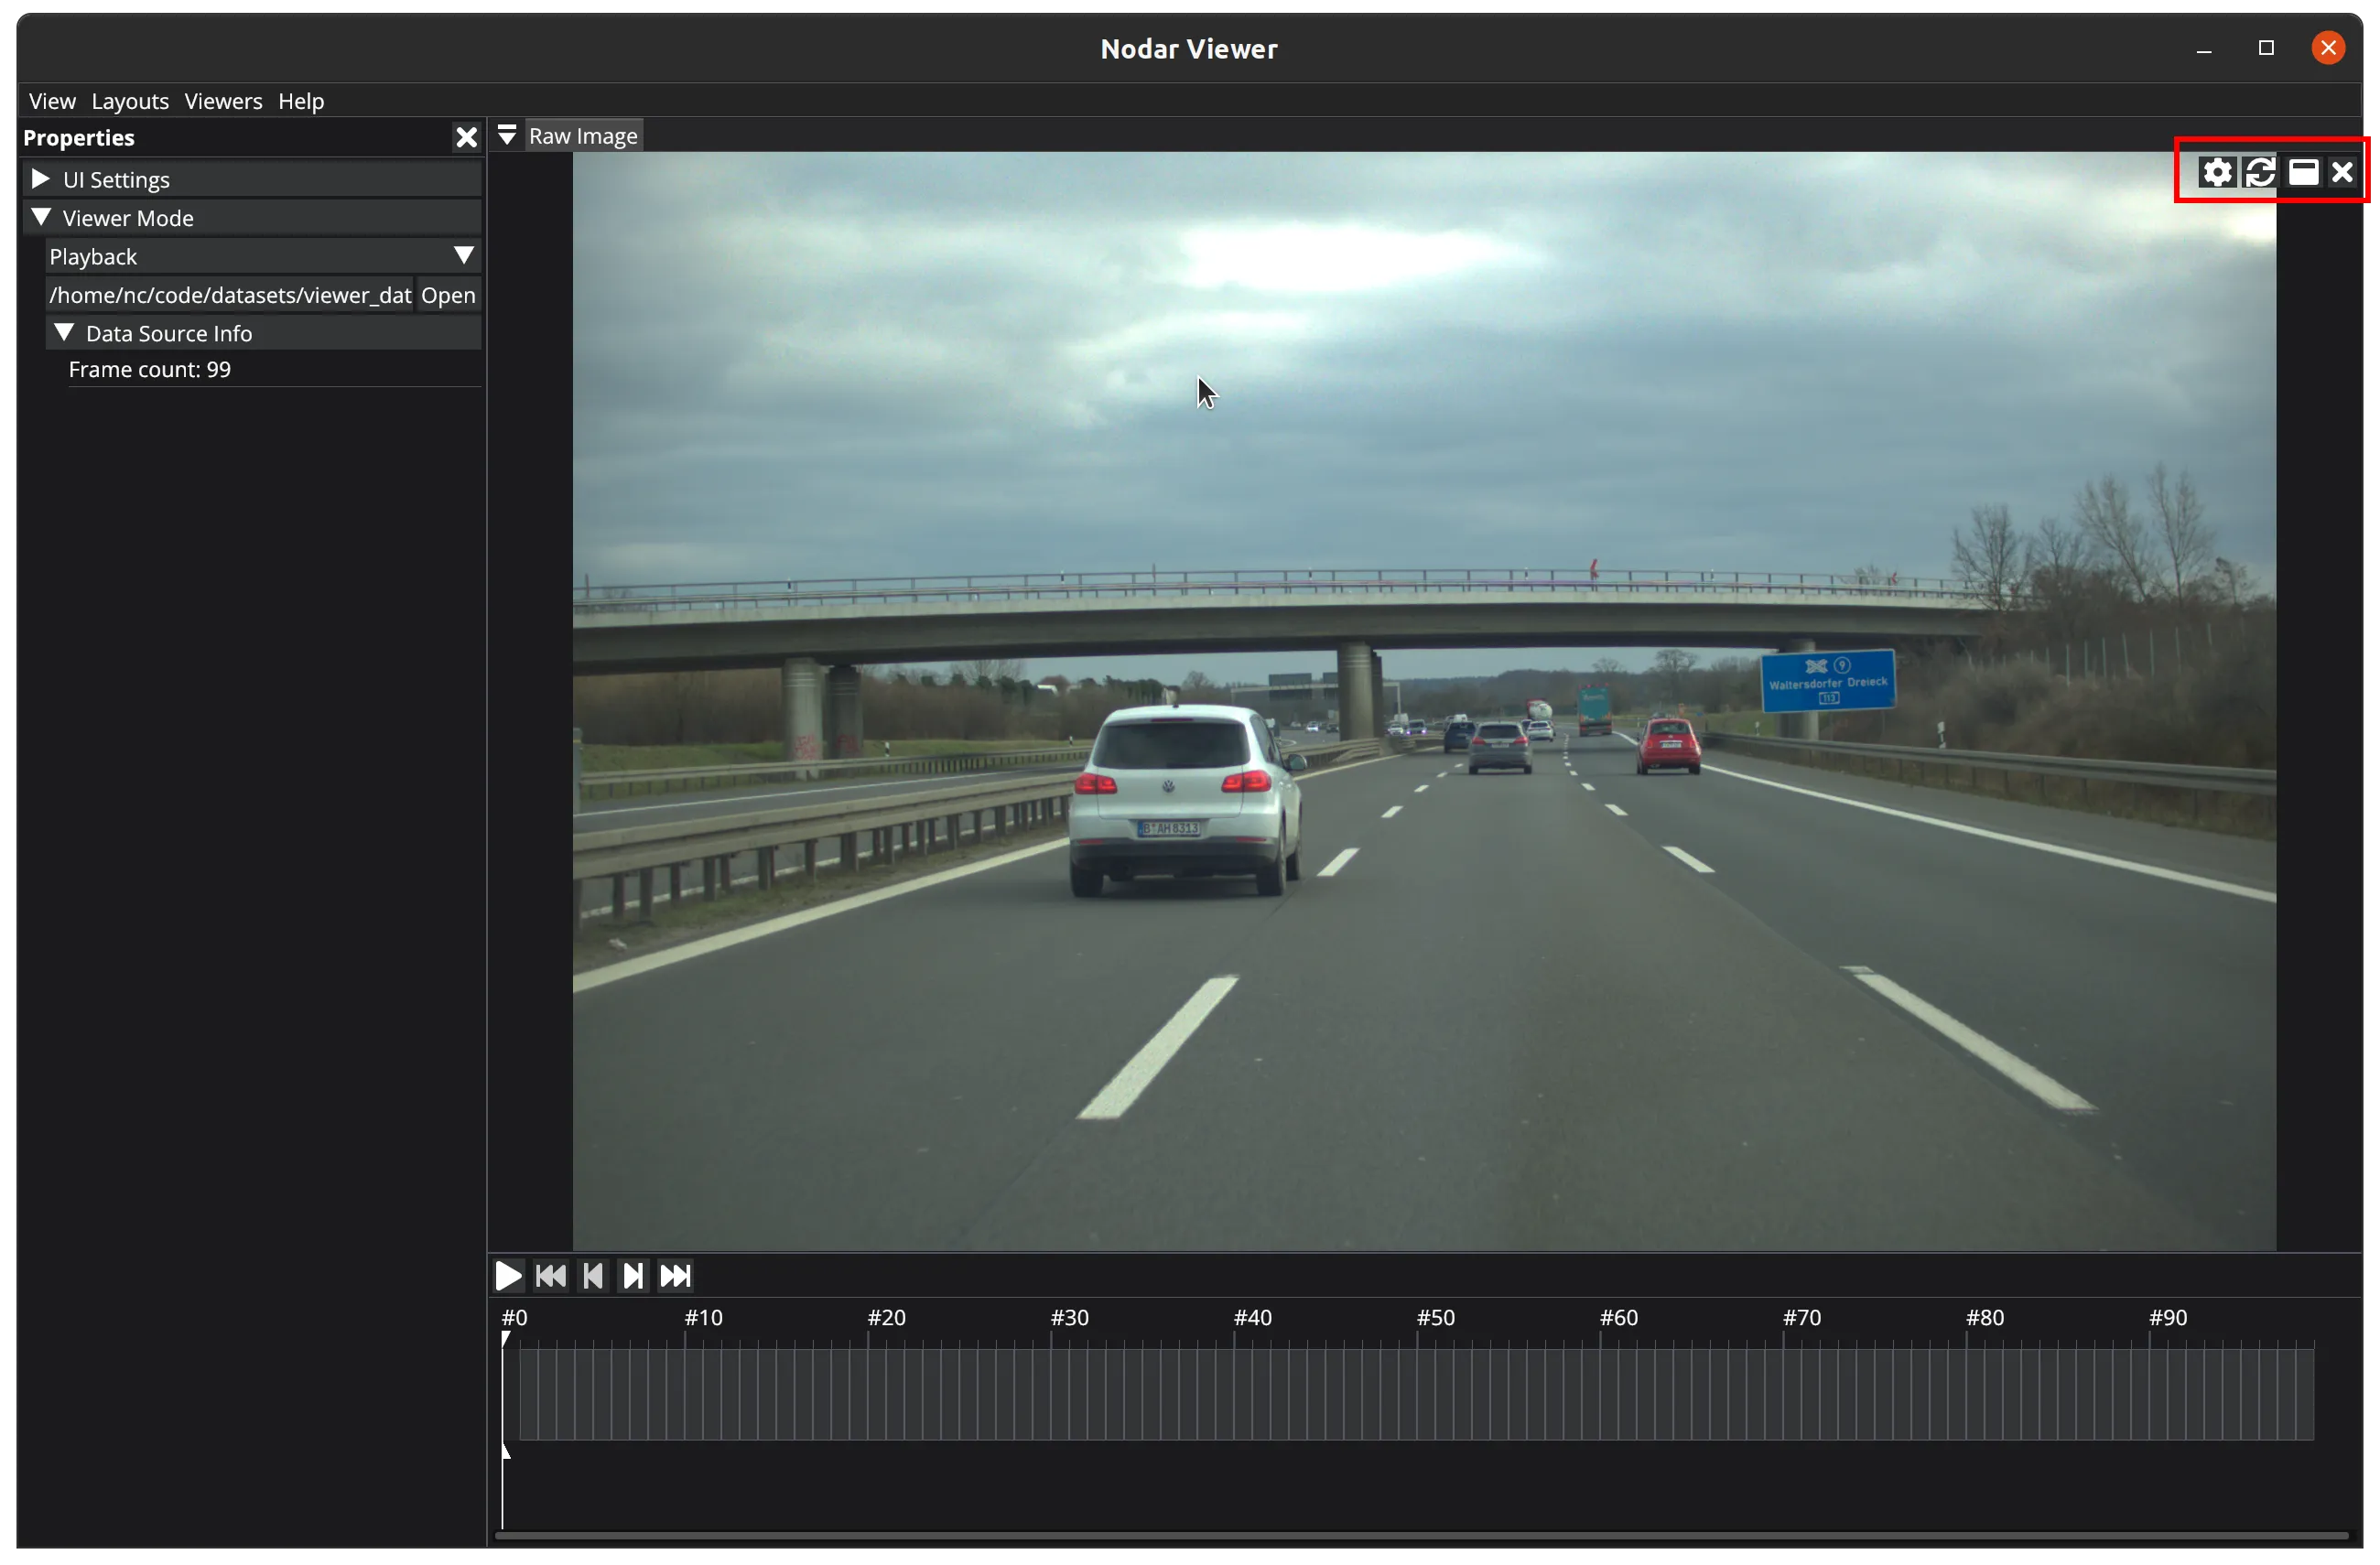
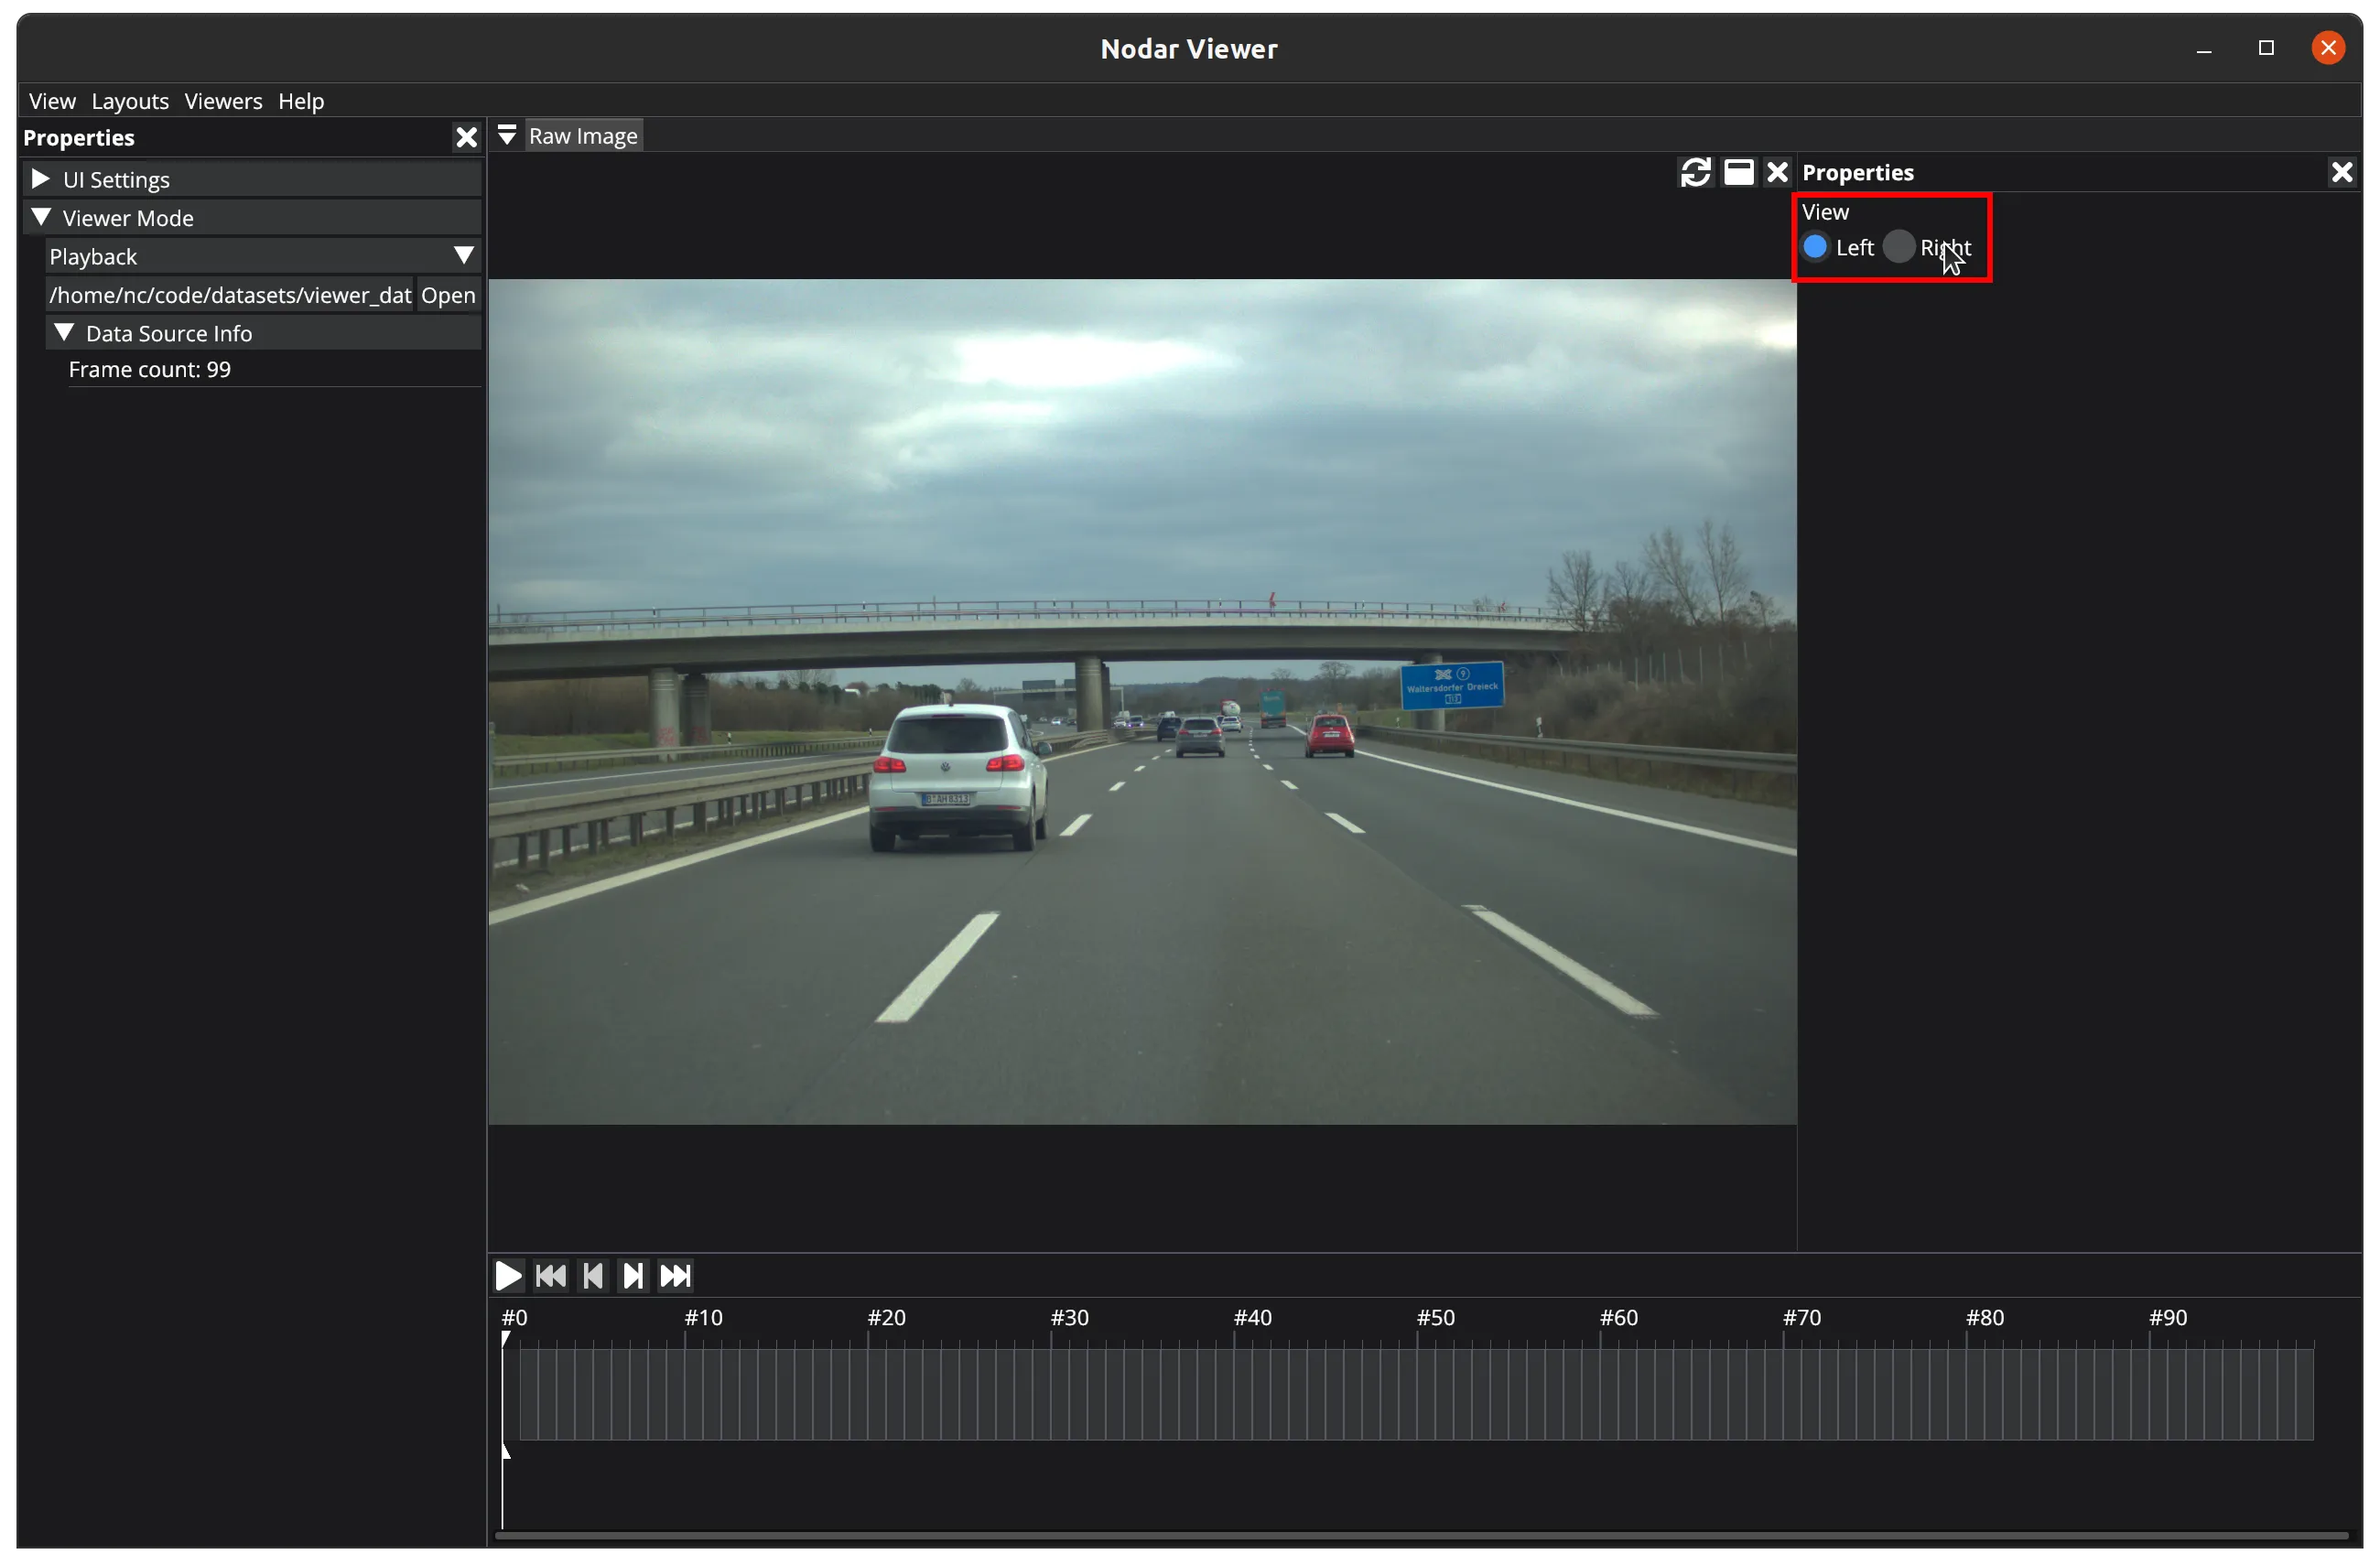
Raw Image
The Raw Viewer displays unprocessed images directly from the cameras. You can toggle between the left and right camera views with the View property.
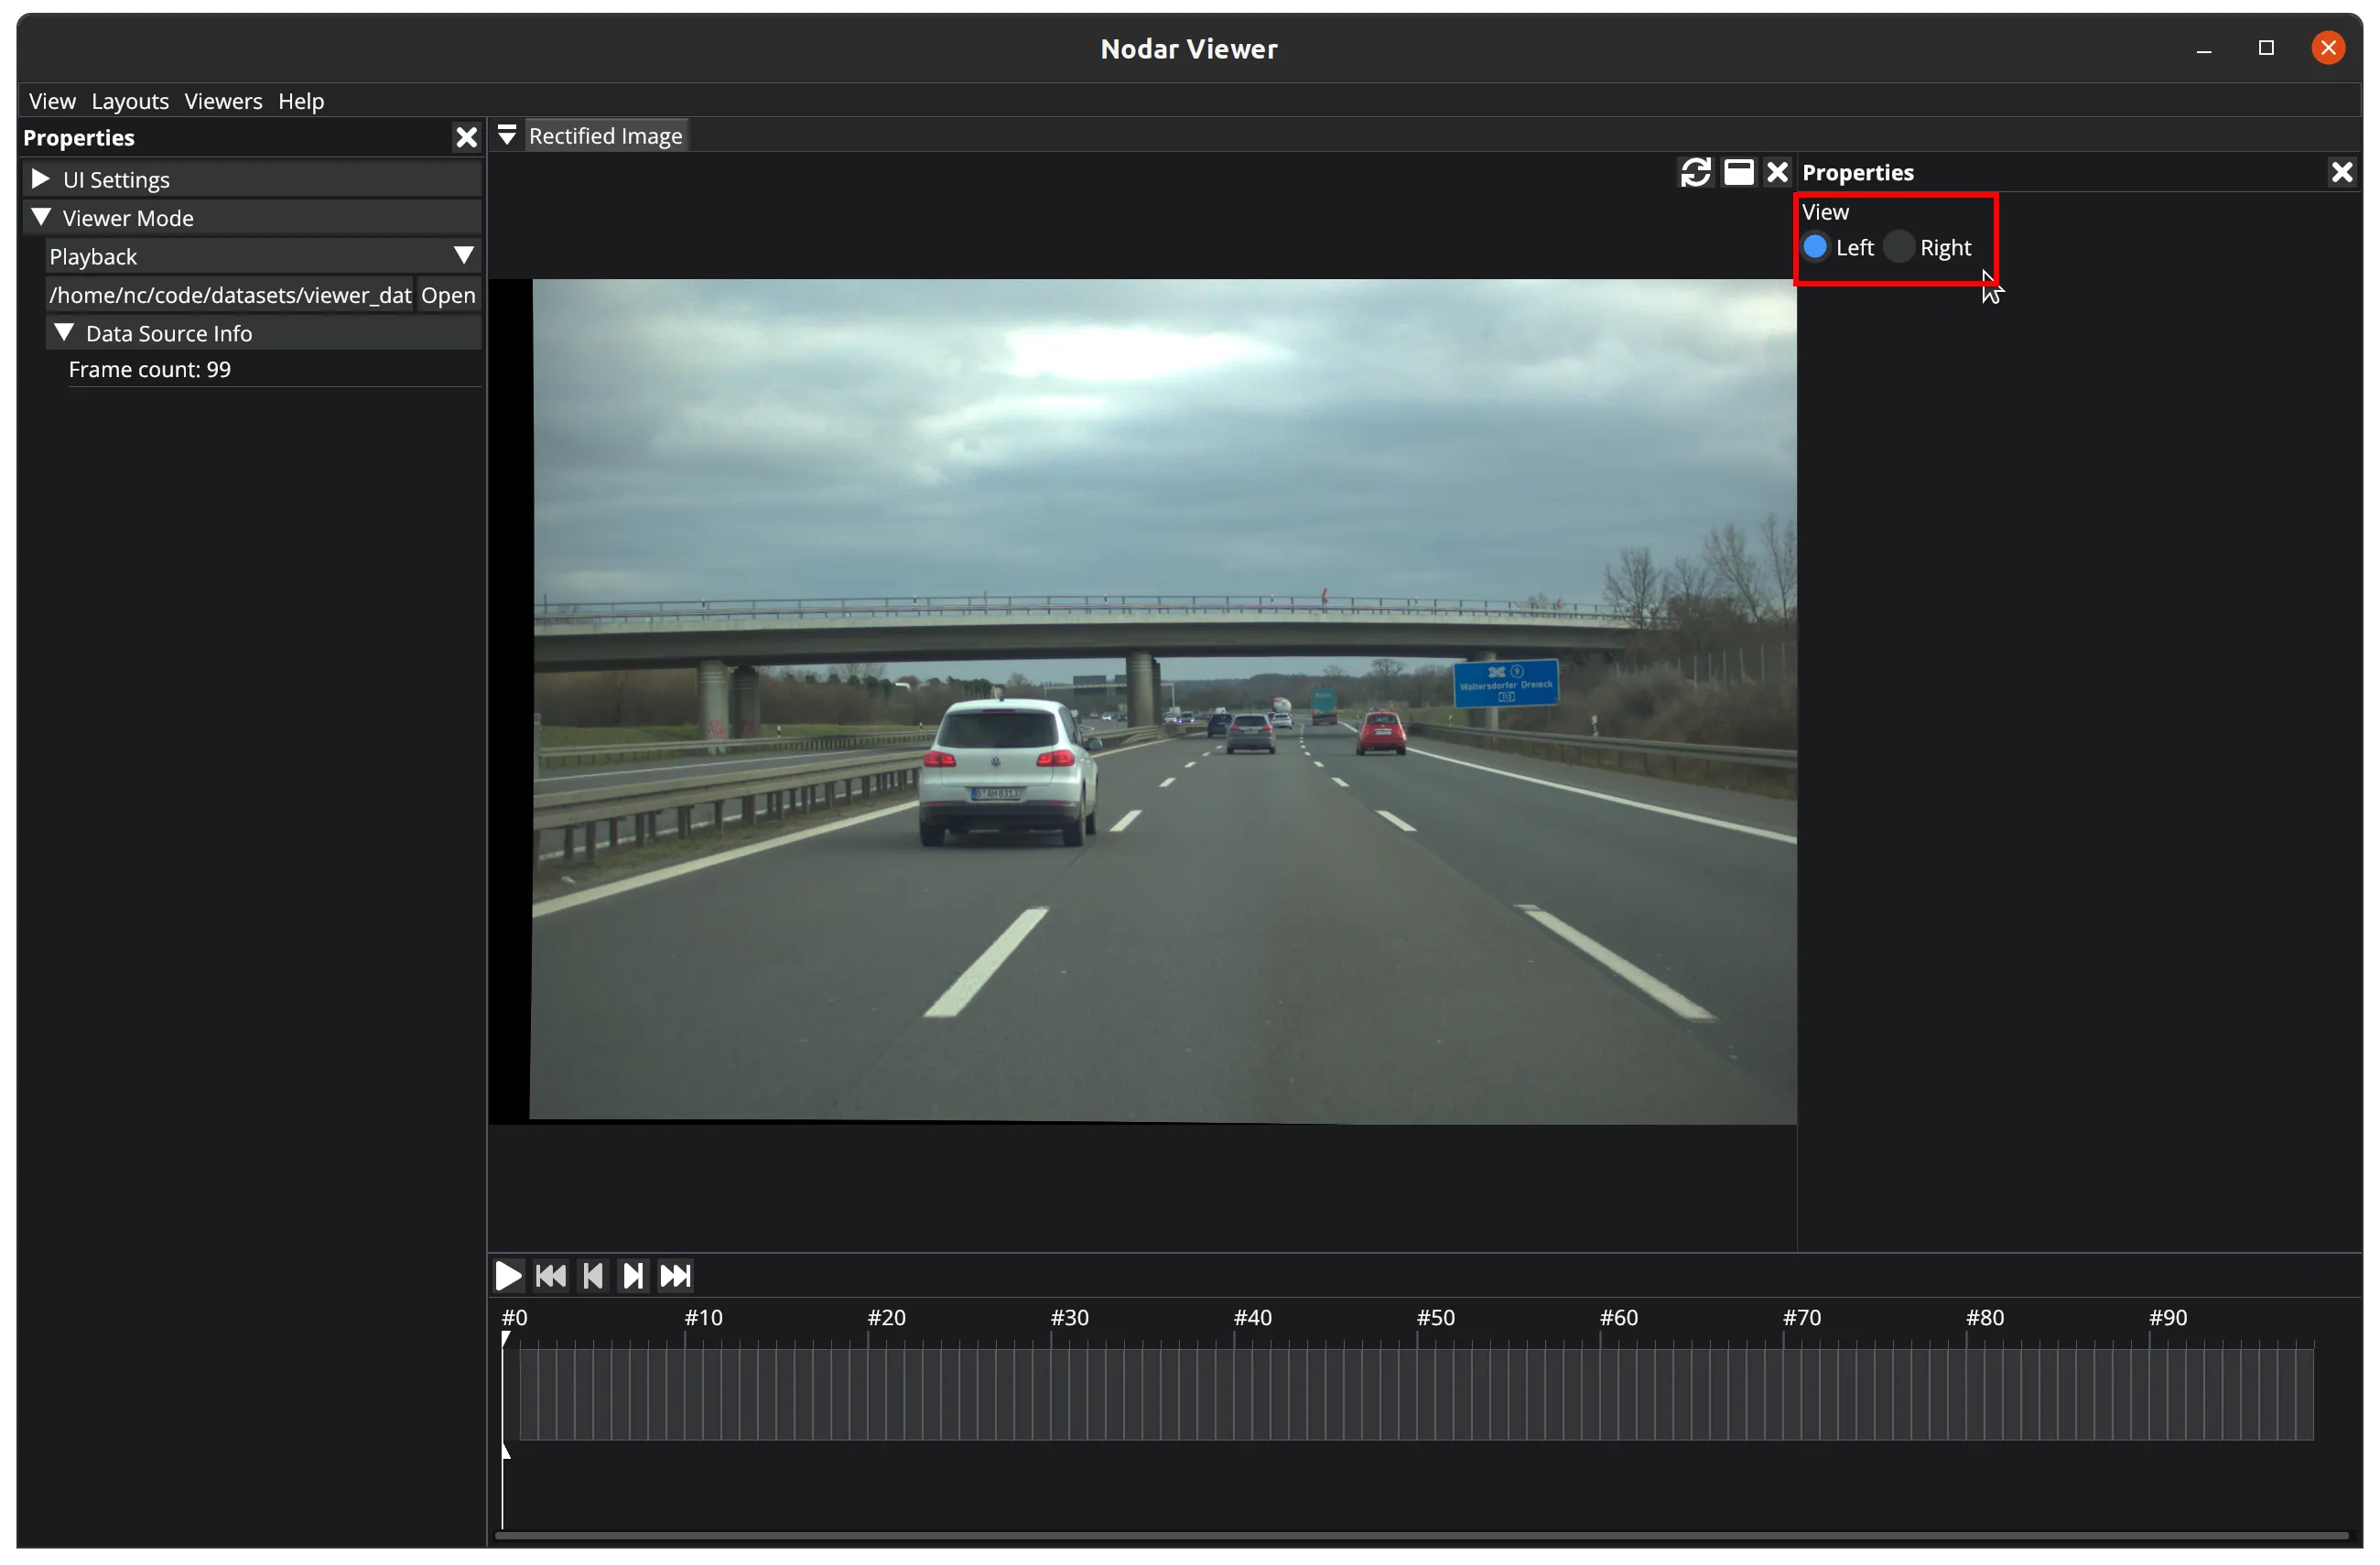
Rectified Image
The Rectified Viewer displays rectified images. You can toggle between the left and right images with the View property.
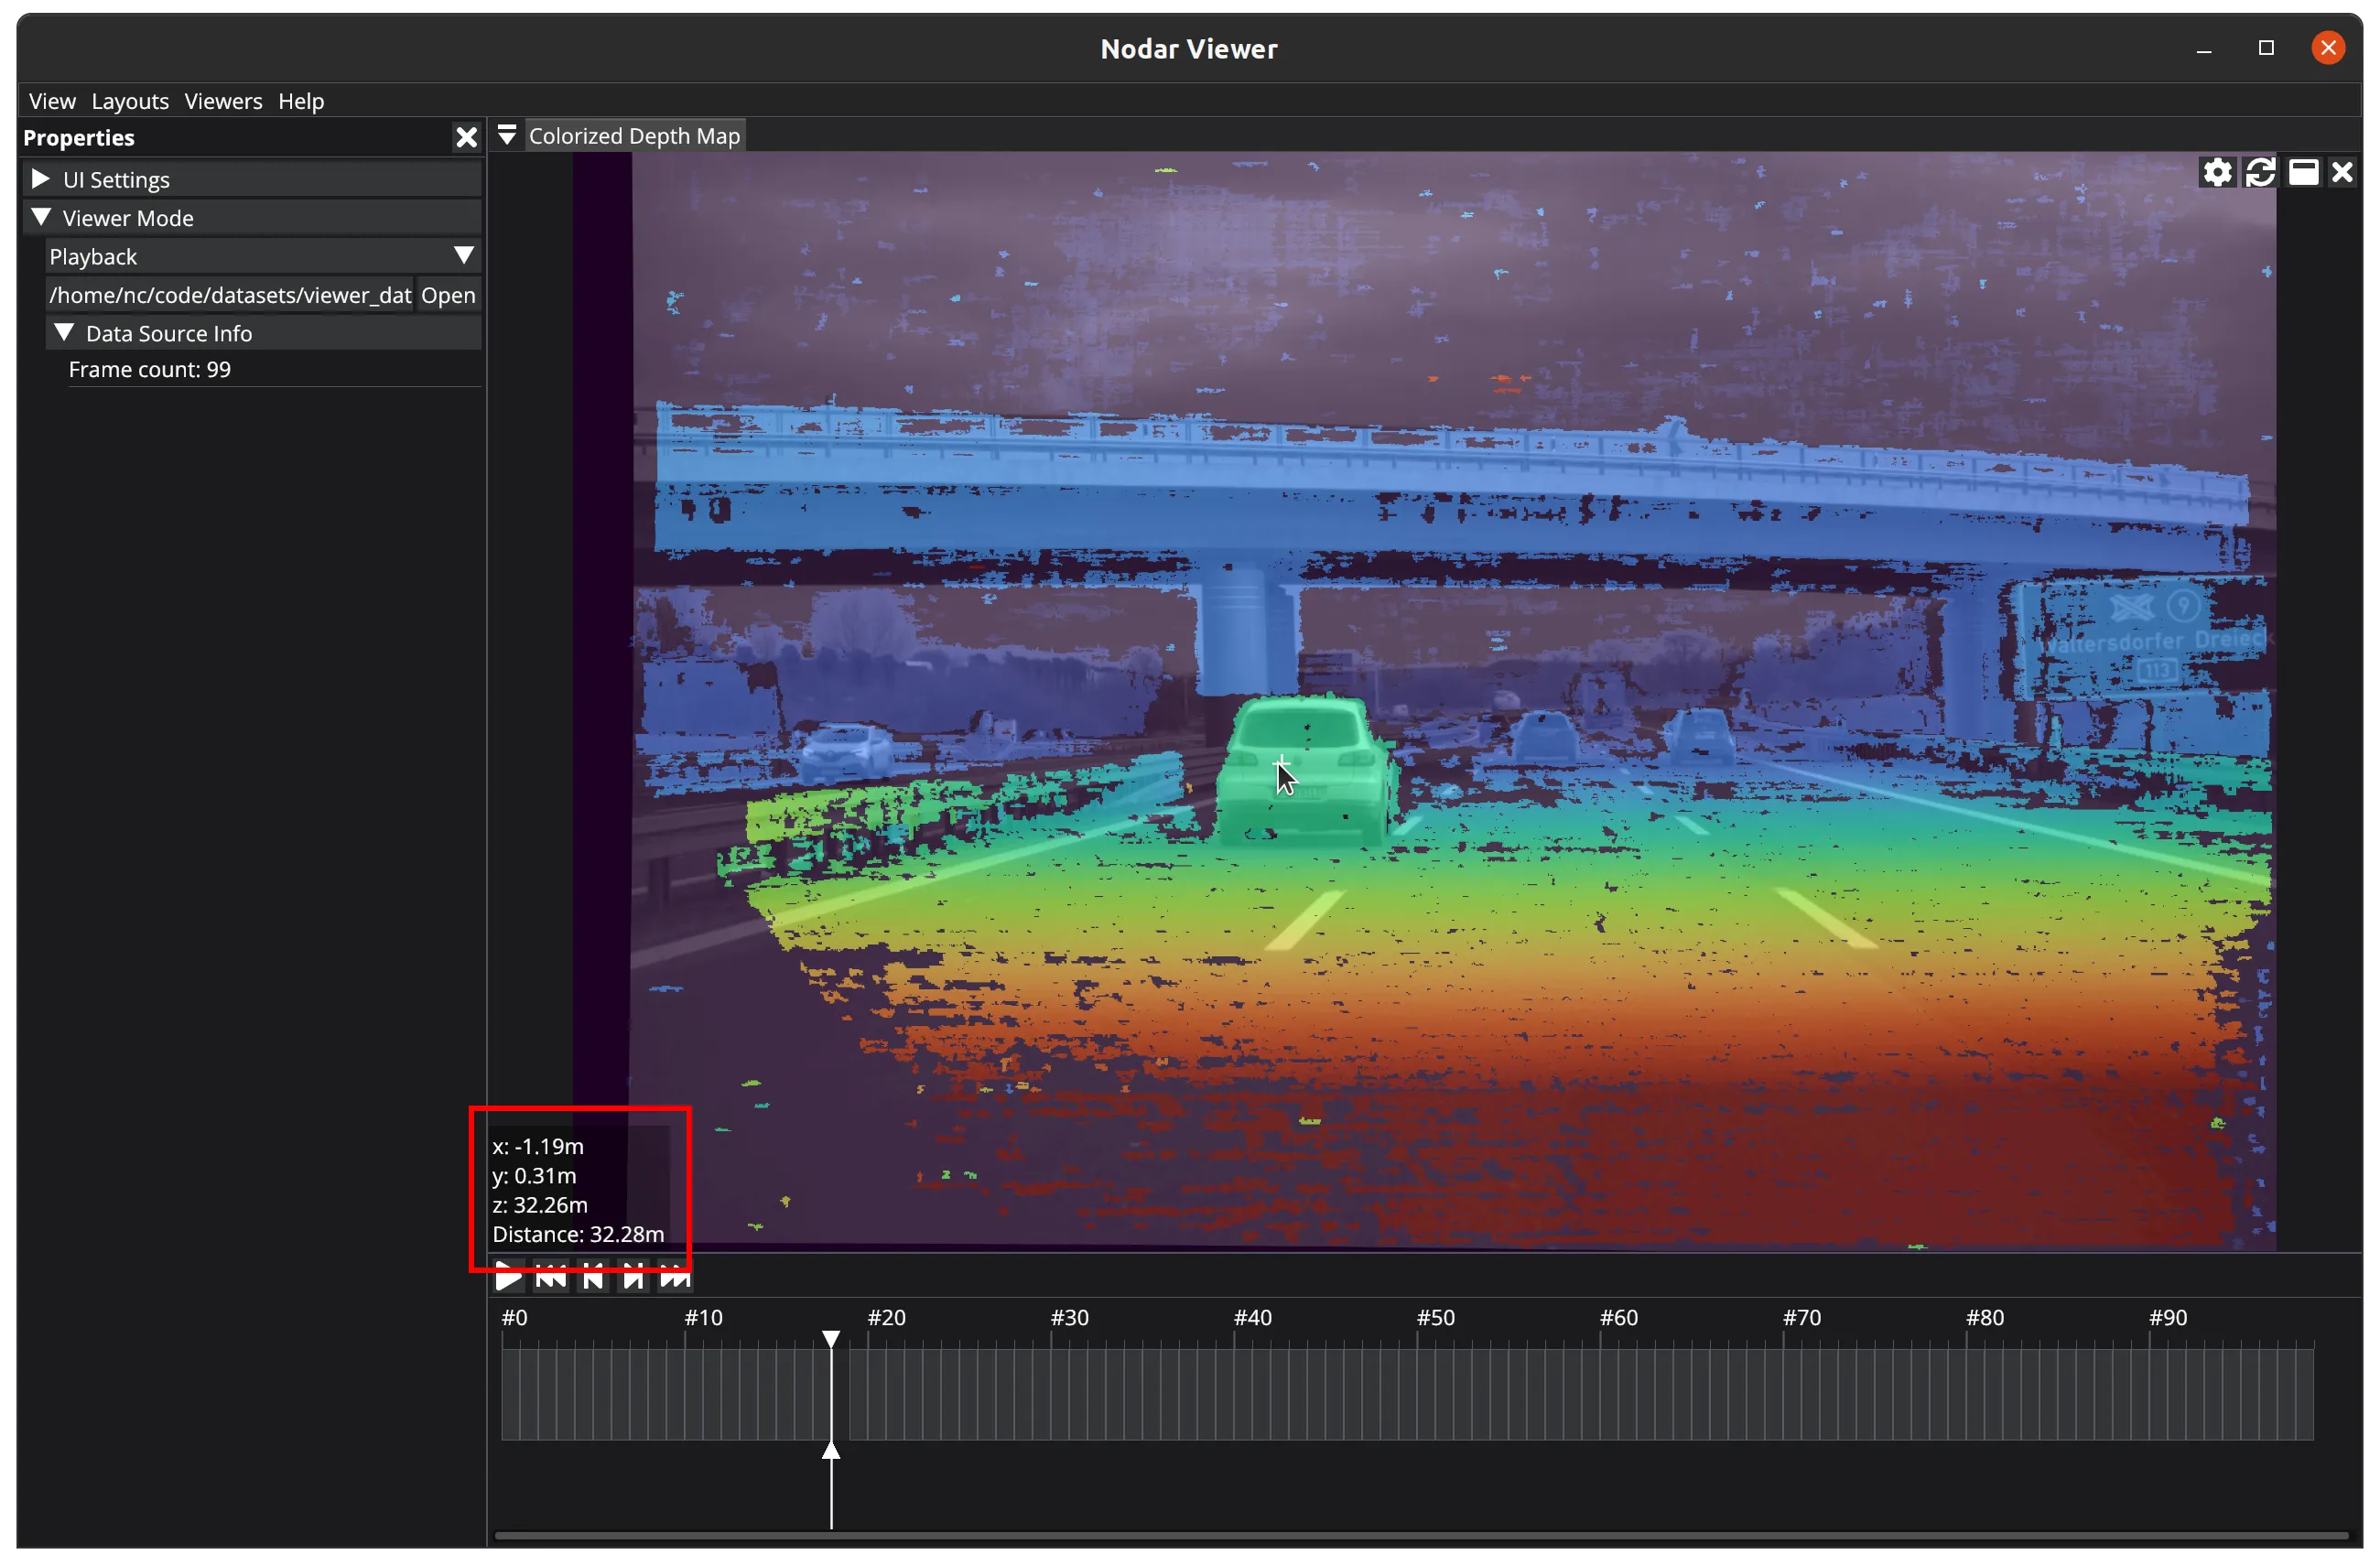
Colorized Depth Map
The Colorized Depth Map viewer combines a rectified image with color-coded depth information.
When you select a colored pixel, it shows the relative position and distance of that point from the camera.
This viewer has no properties.
Point Cloud
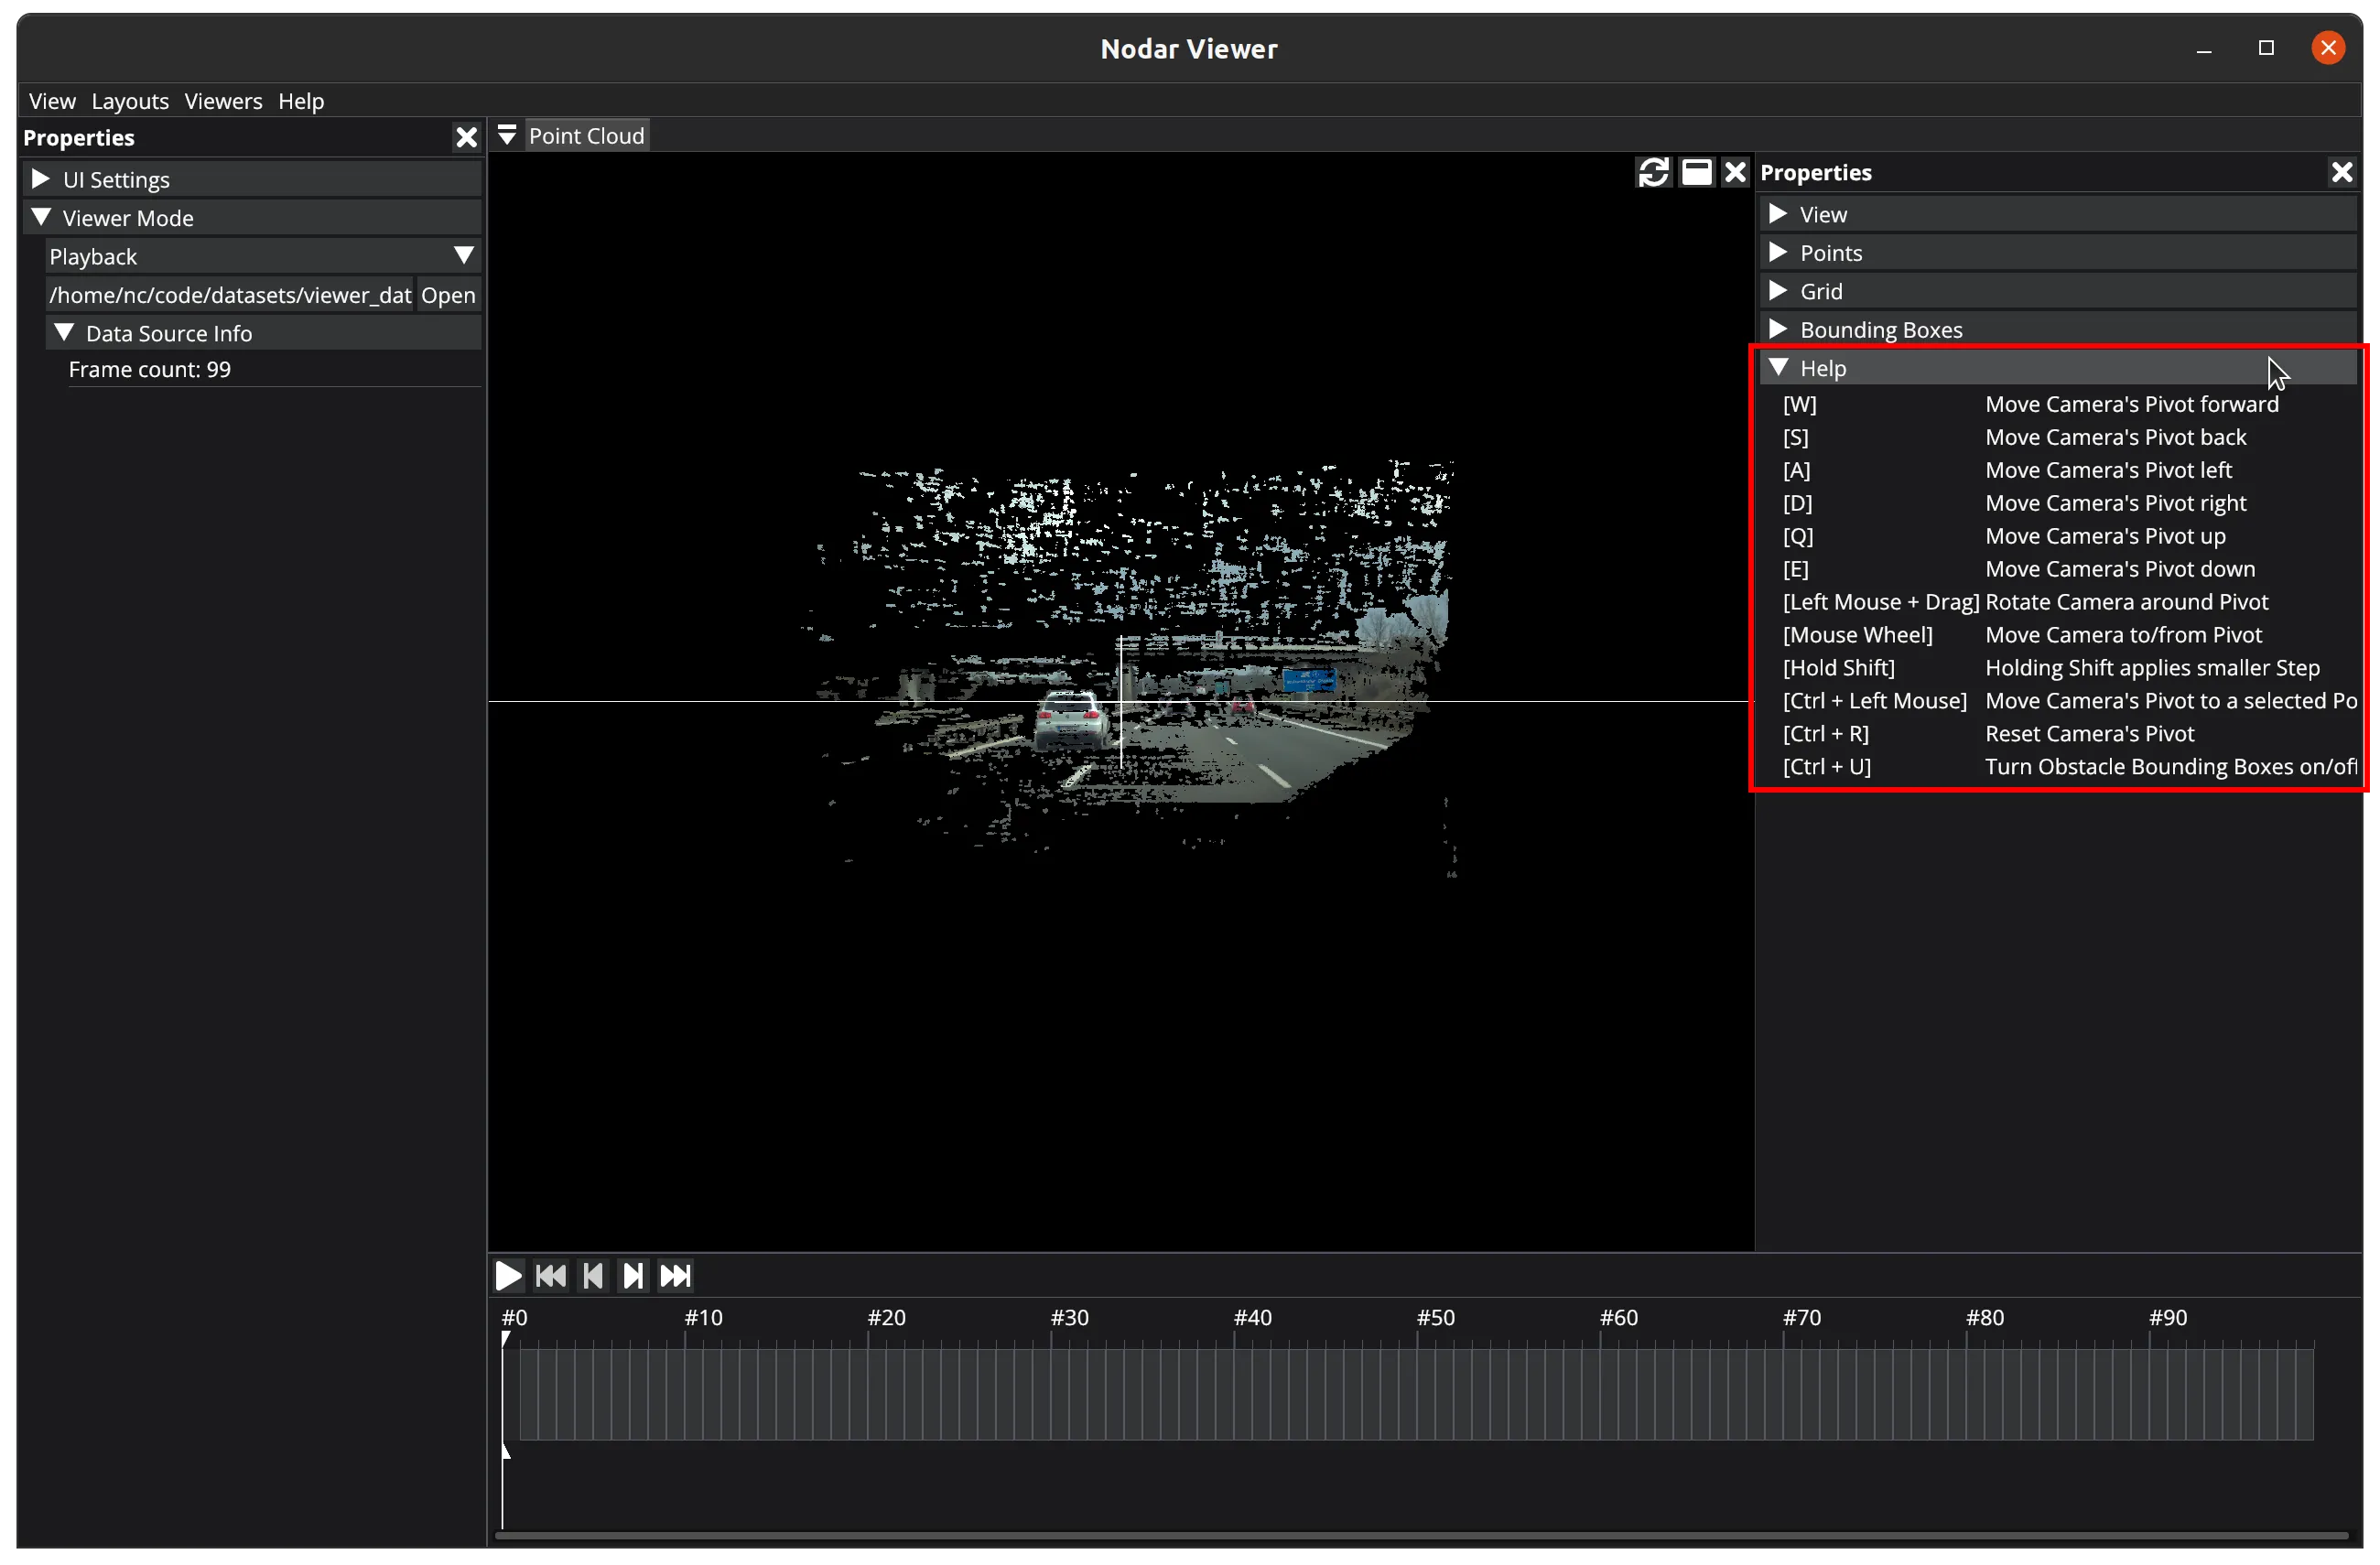
The Point Cloud viewer shows a 3D representation of depth data as points in space. You can navigate this 3D view using your keyboard and mouse:
- Hold and drag the left mouse button to rotate the 3D camera around the pivot point. For finer control, hold
Left Shiftwhile rotating. - Use
W,A,S,Dto move the 3D camera and the pivot point: forward (W), left (A), backward (S), and right (D). For finer control, holdLeft Shiftwhile moving. - Use
Q,Eto move the 3D camera and the pivot point: up (Q), and down (E). For finer control, holdLeft Shiftwhile moving. - Use the mouse wheel to zoom the 3D camera toward or away from the pivot point. For finer control, hold
Left Shiftwhile zooming. - Hold
Ctrland select a 3D point to move both the camera and pivot to that location. - Press
Ctrl + Rto reset the 3D view.
The Point Cloud viewer has several properties that let you manipulate the 3D point cloud.
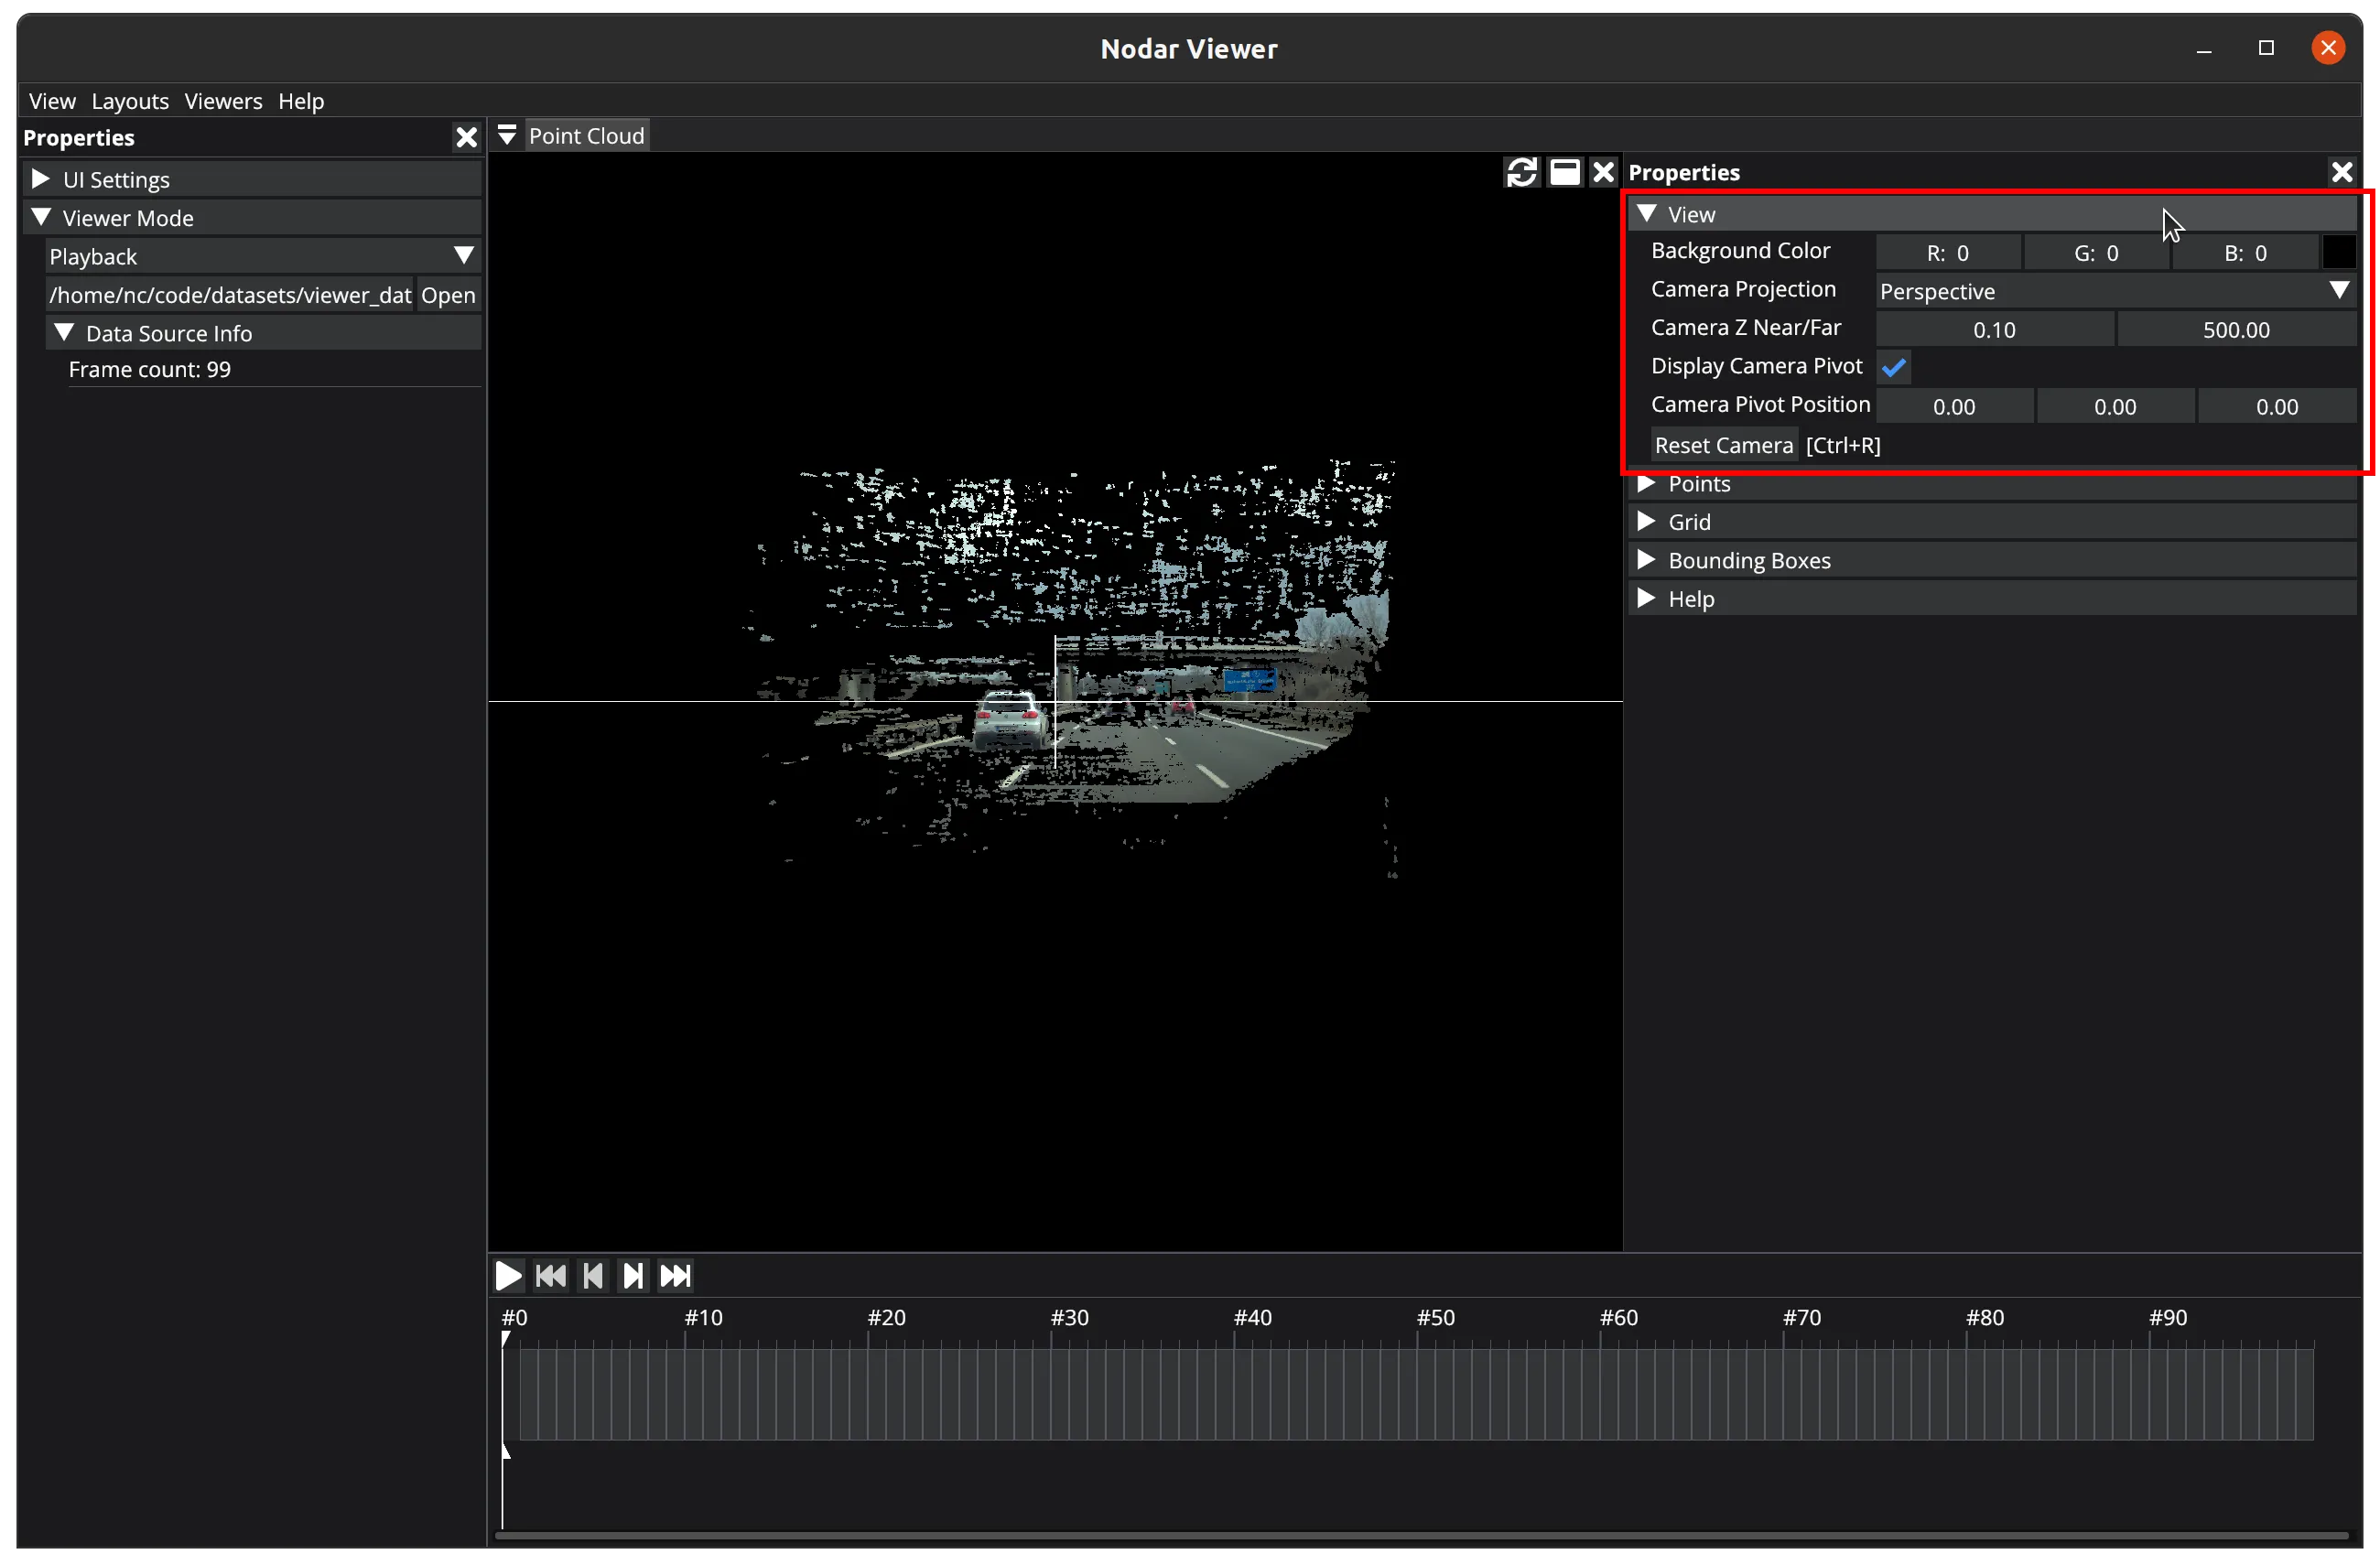
View
In the View section, you can:
Background Color— Set the background color of the 3D view.Camera Projection— Change 3D camera projection type betweenPerspectiveandOrthographic. Note:Orthographicprojection maintains consistent distances between lines regardless of depth, which can make keyboard navigation more challenging.Camera Z Near/Far— Adjust the near and far clipping planes of the 3D camera viewport.Display Camera Pivot— Toggle the visibility of the 3D camera pivot point.Camera Pivot Position— Manually adjust the 3D camera pivot position. This provides precise control over the position in 3D space, as an alternative to keyboard movement.Reset Camera— Reset the 3D view.
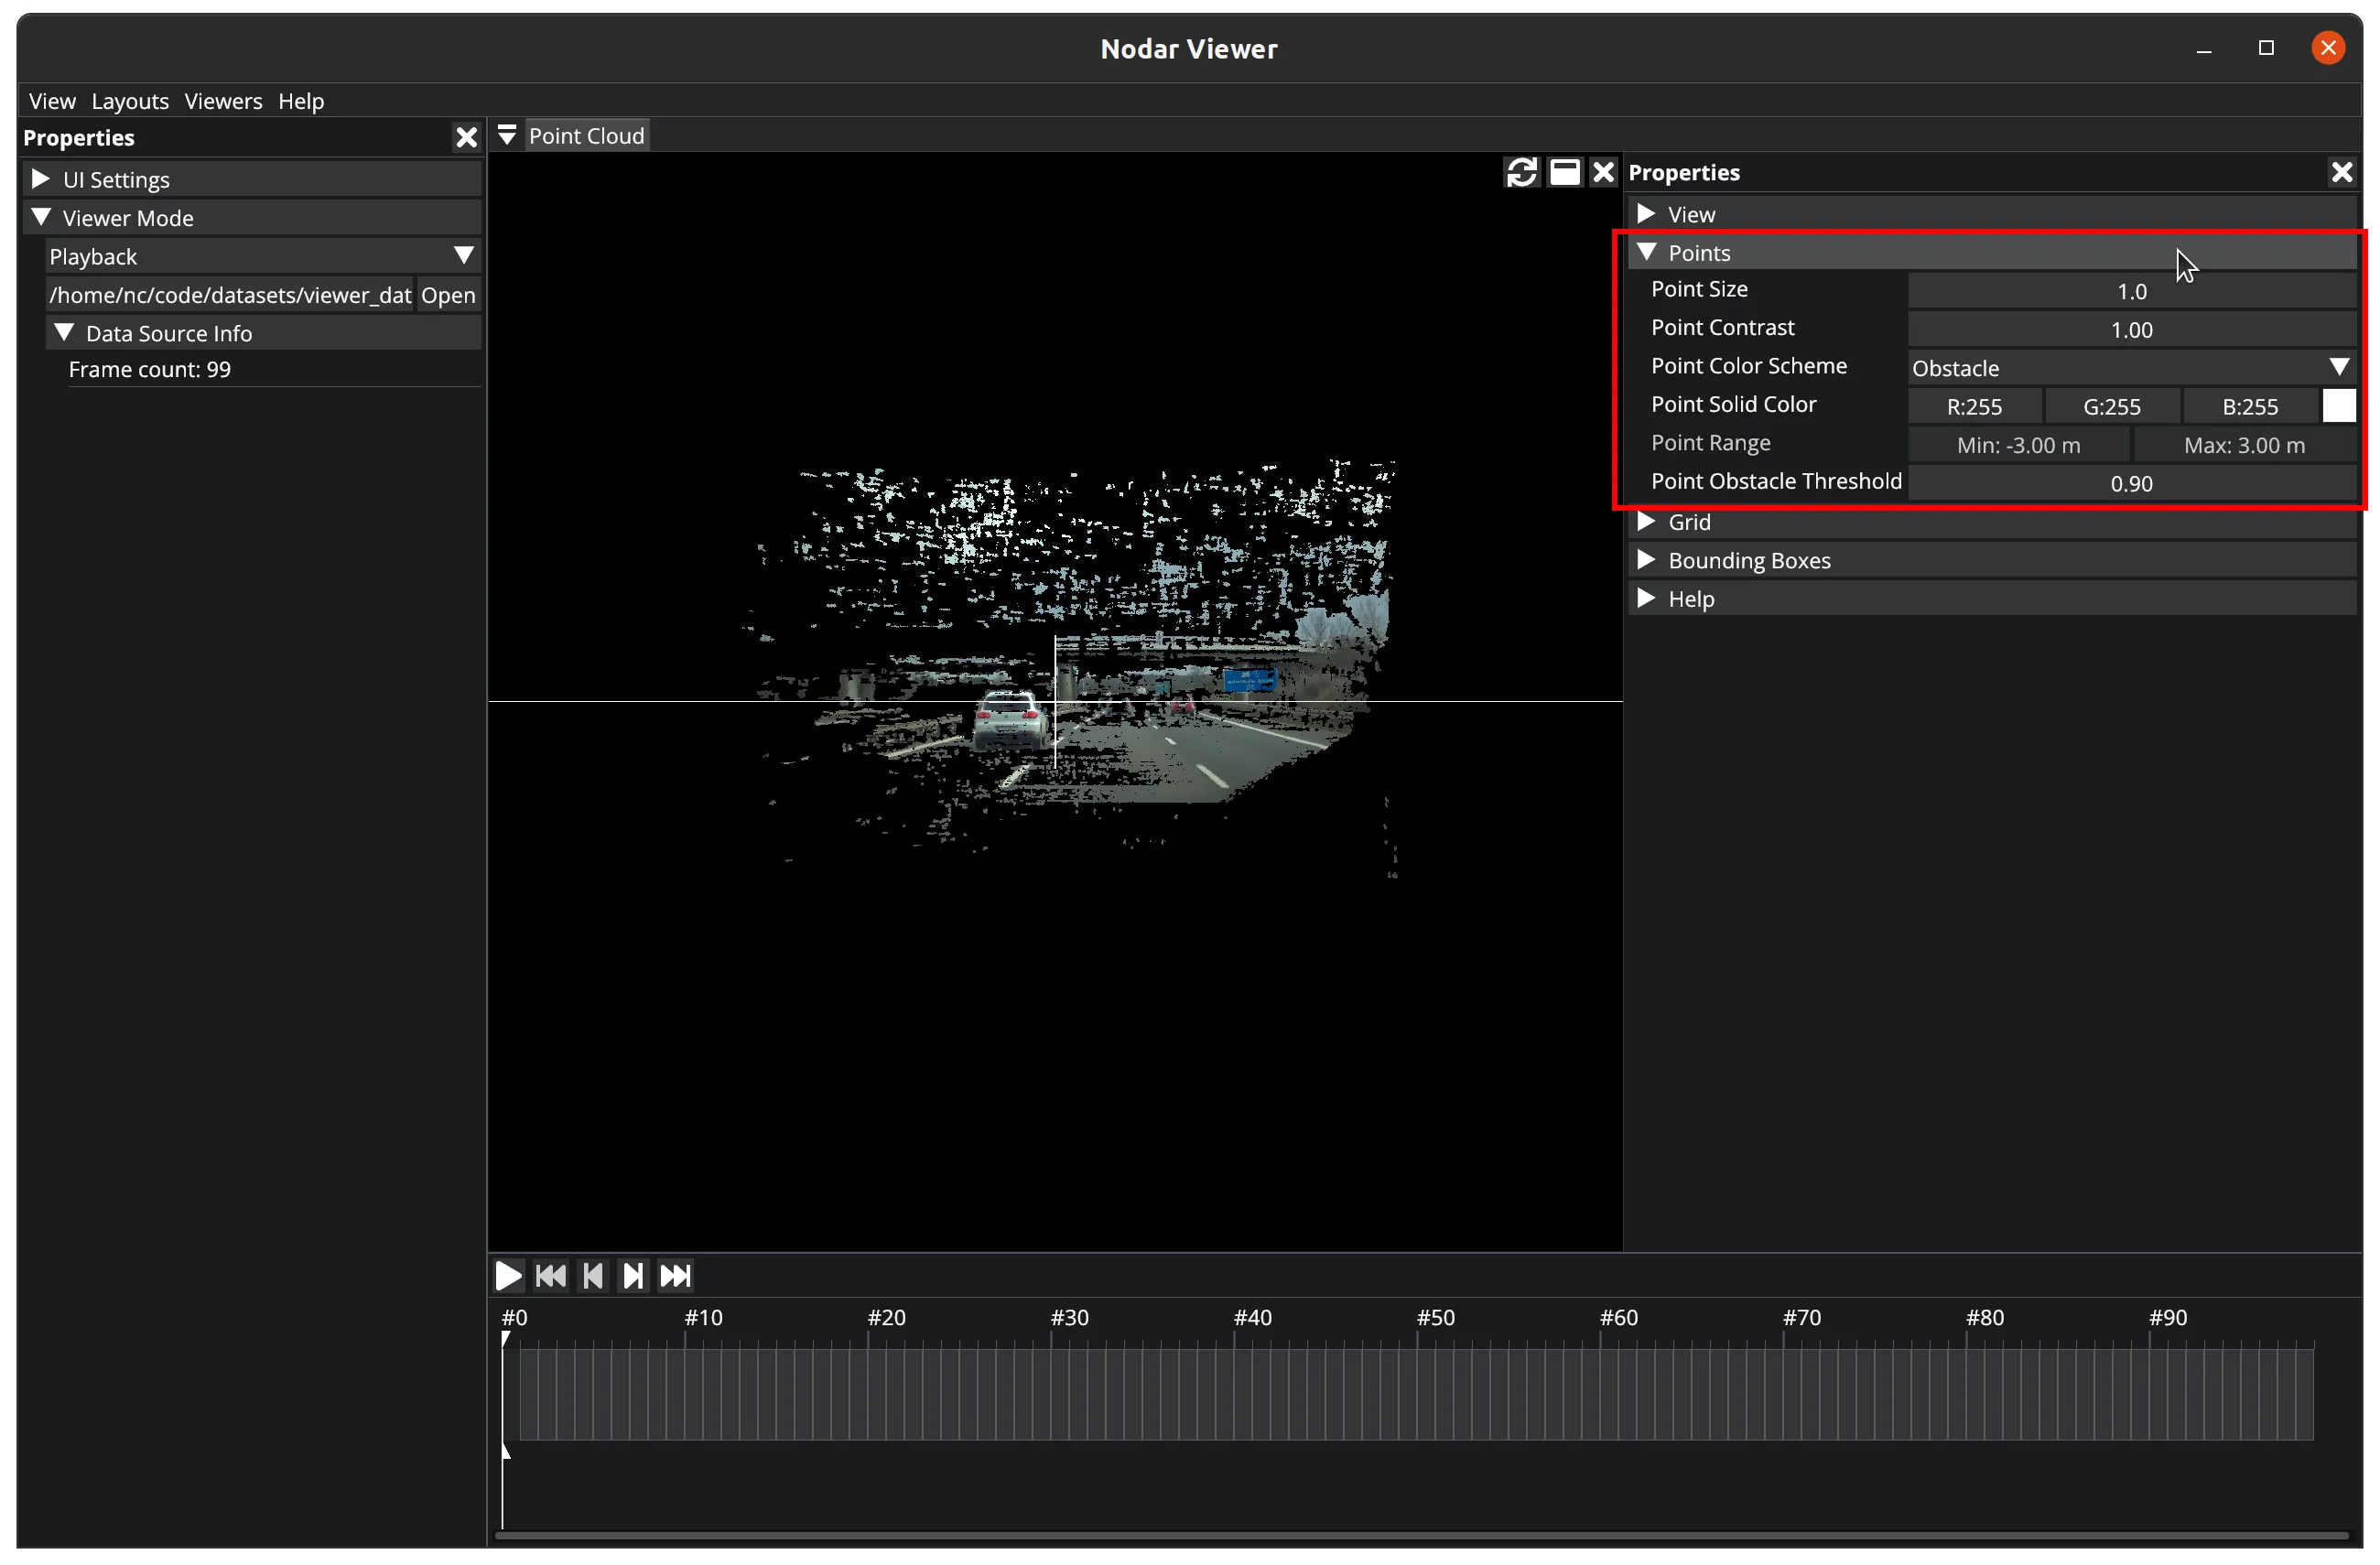
Points
In the Points section, you can:
Point Size— Adjust the size of points in the point cloud.Point Contrast— Adjust the contrast of points.Point Color Scheme— Select from these color schemes:Solid— applies a single, uniform color to all points. You can choose this color using thePoint Solid Colorproperty.Image— assigns colors to points based on the left rectified image.Range— assigns colors to points based on their distance from the camera. Using thePoint Rangeproperty, you can set minimum and maximum distances to determine how the gradient colors are distributed.Height— assigns colors to points based on their height. Use thePoint Rangeproperty to set minimum and maximum height values that determine how gradient colors are distributed.Obstacle— assigns colors to points based on obstacle detector data. With thePoint Solid Colorproperty, you can choose a color for detected obstacles. Using thePoint Obstacle Thresholdproperty, you can set the threshold that determines if a point is classified as an obstacle. Note: This color scheme requires launchingHammerheadwith the obstacle detector enabled.
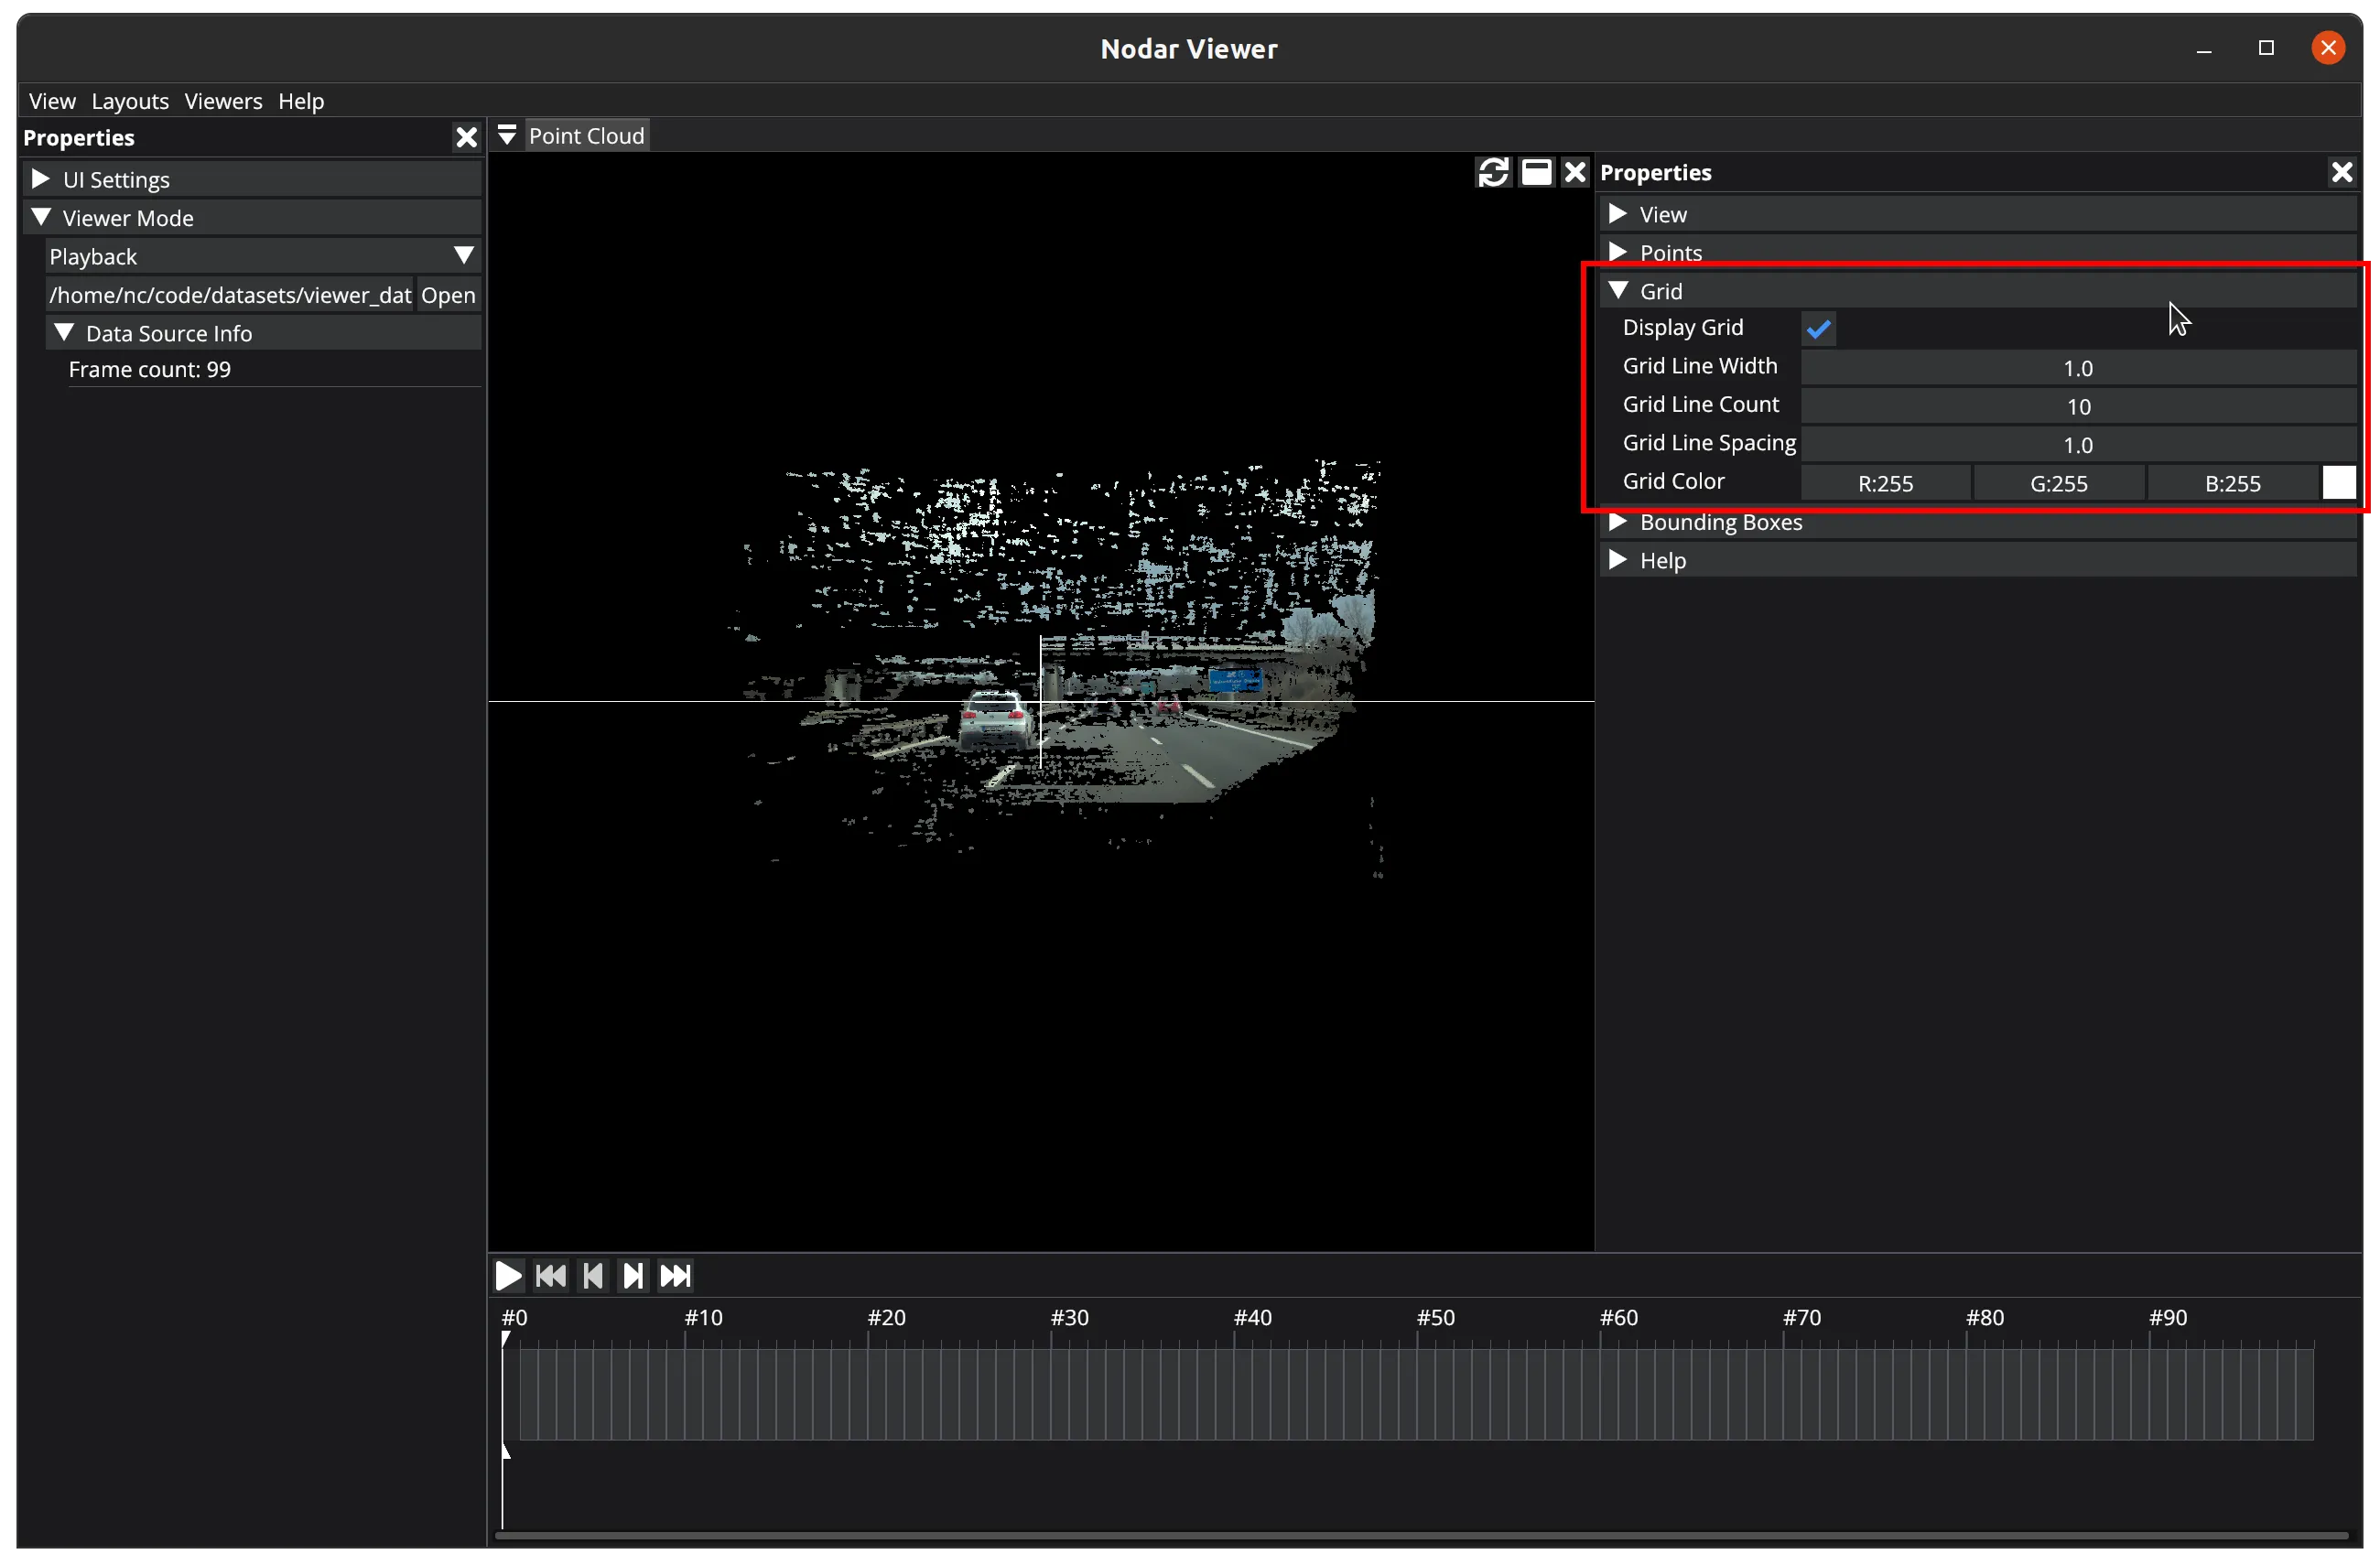
Grid
In the Grid section, you can:
Display Grid— Toggle the 3D grid's visibility.Grid Line Width— Adjust the thickness of 3D grid lines.Grid Line Count— Change the number of 3D grid lines. This value determines how many lines appear in each direction (+z,-z,+x,-x). For example, setting it to 3 creates three lines in each direction.Grid Line Spacing— Adjust the spacing between 3D grid lines.Grid Color— Set the color of 3D grid lines.
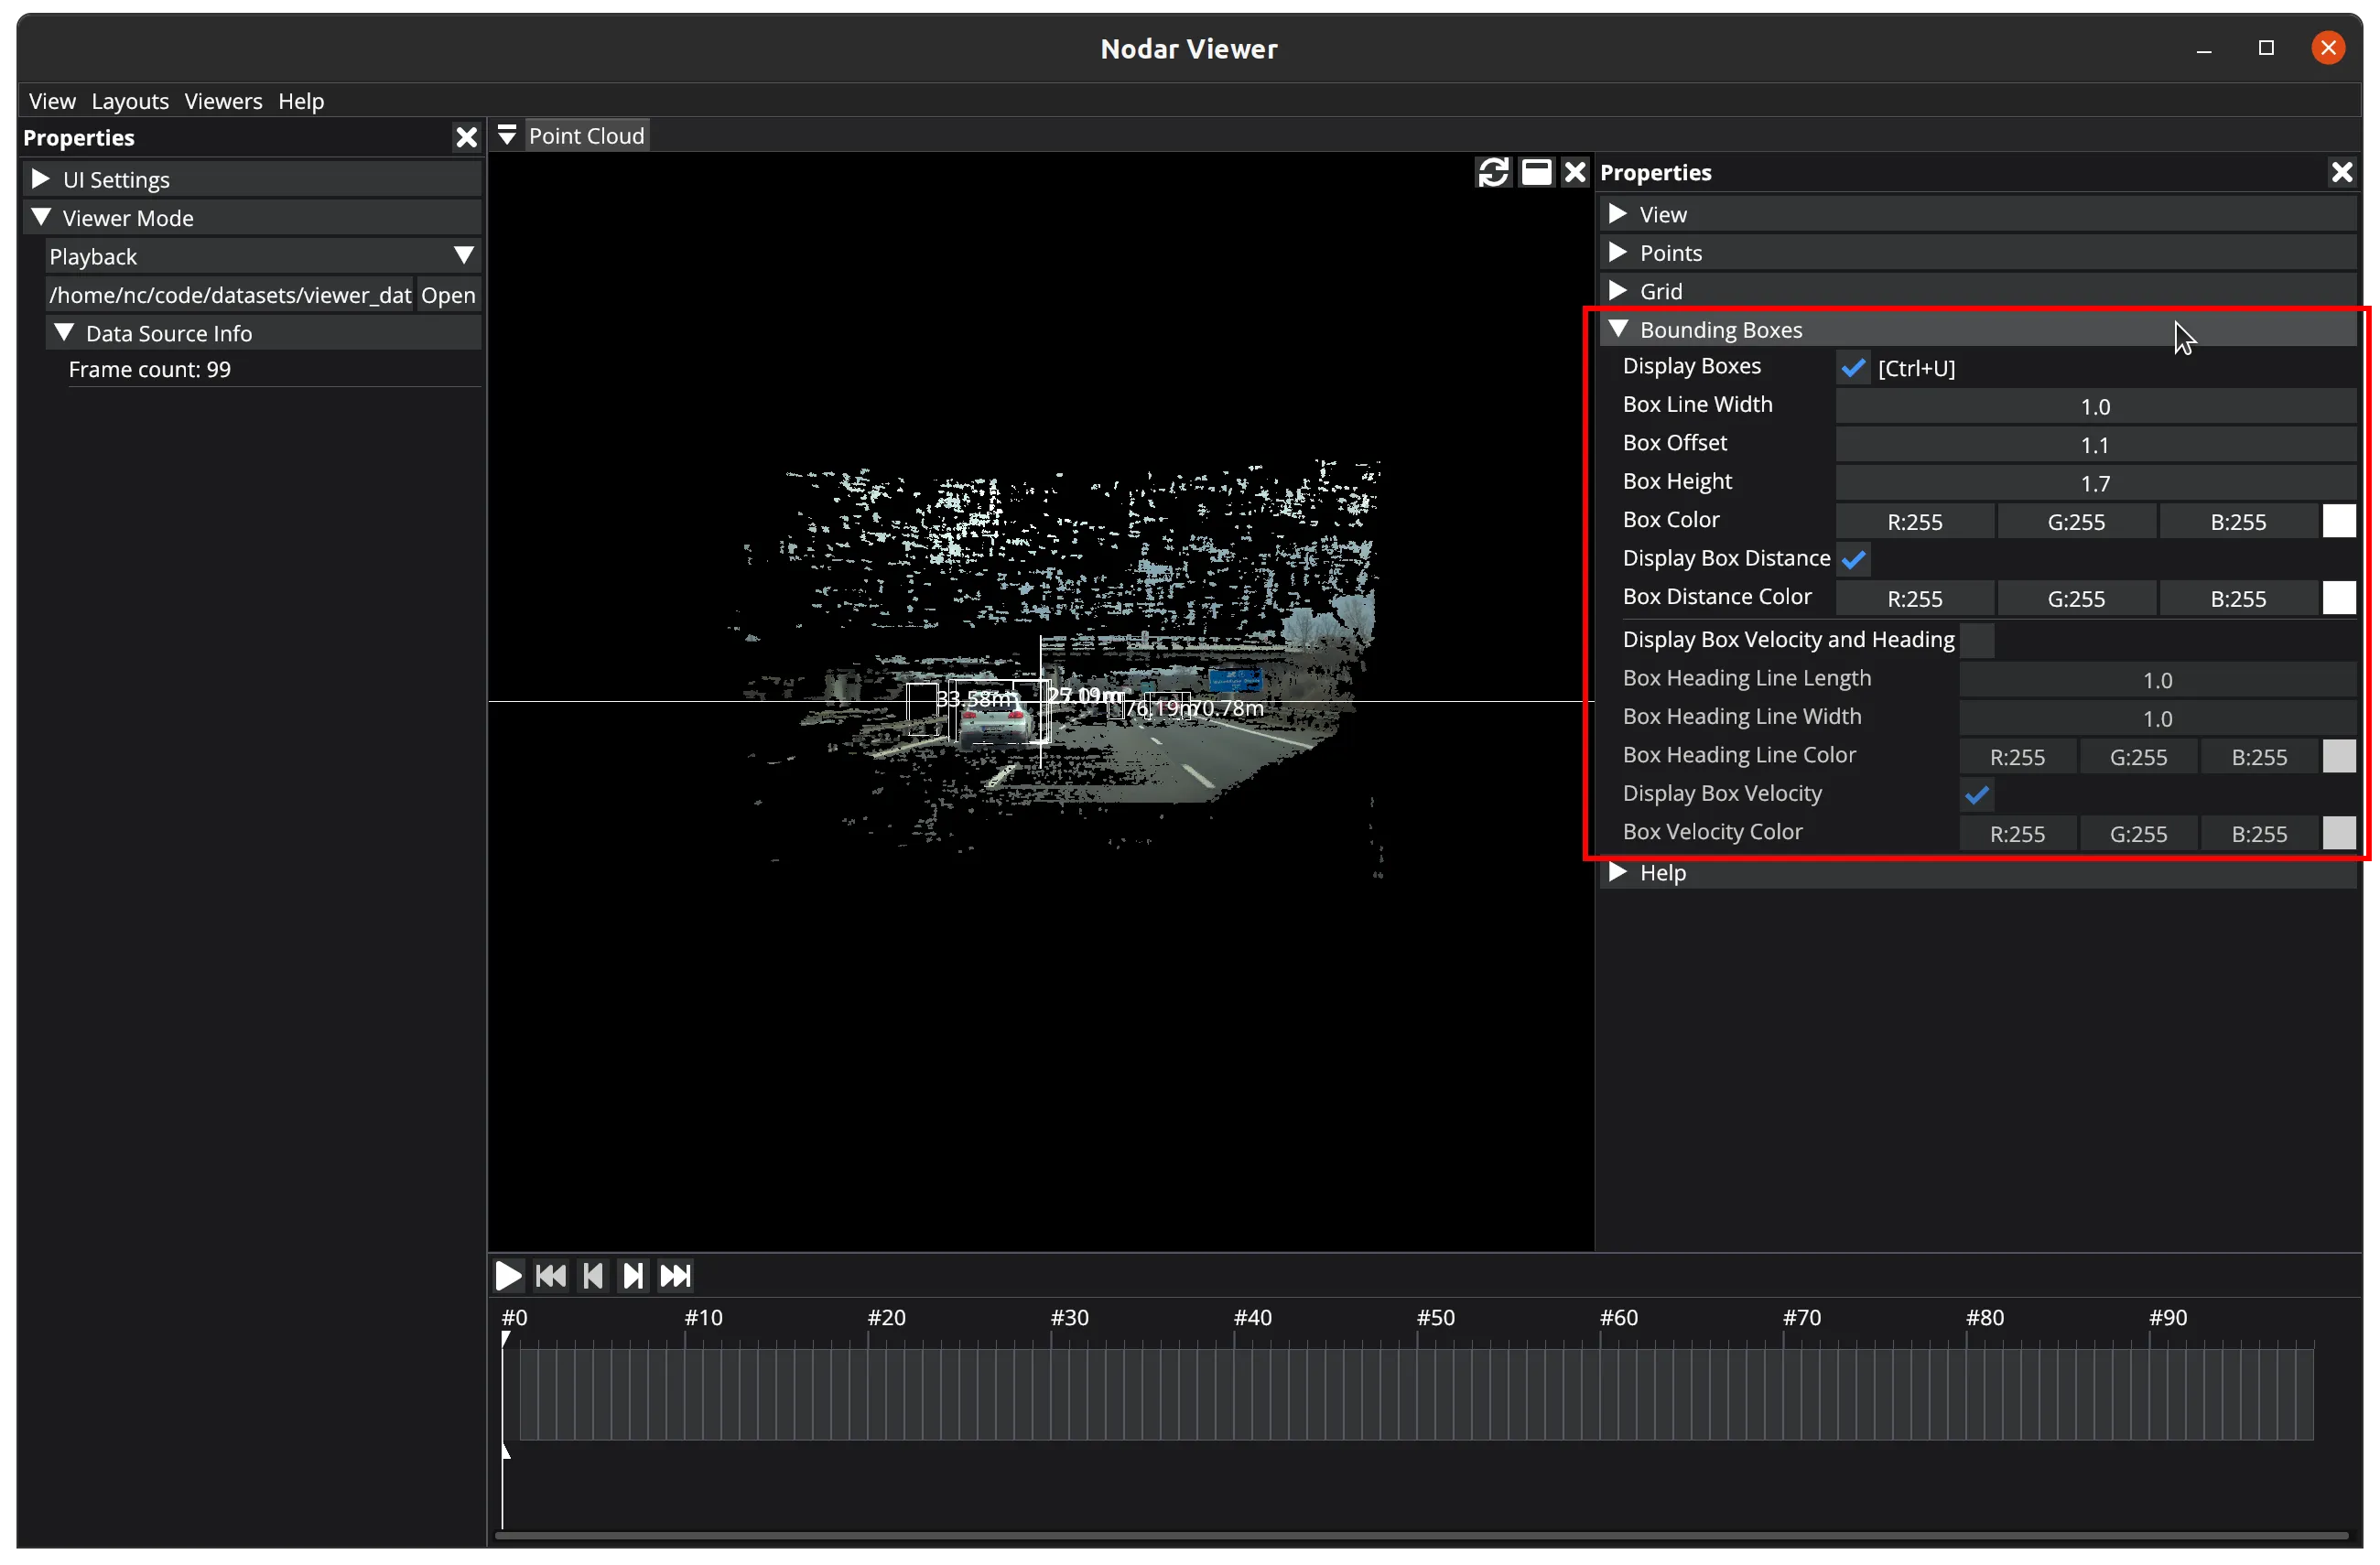
Bounding Boxes
In the Bounding Boxes section, you can:
Display Boxes— Toggle the visibility of bounding boxes around detected obstacles.Box Line Width— Adjust the thickness of bounding box lines.Box Offset— Adjust they-position of bounding boxes.Box Height— Adjust the height of bounding boxes.Box Color— Set the color of bounding box lines.Display Box Distance— Toggle the visibility of distance labels on bounding boxes. The label displays the distance to the closest point of each box.Box Distance Color— Set the color of the distance labels.Display Box Velocity and Heading— Toggle the visibility of detected obstacle velocities and direction vectors.Box Heading Line Length— Adjust the length of direction vectors.Box Heading Line Width— Adjust the thickness of direction vectors.Box Heading Line Color— Set the color of direction vectors.Display Box Velocity— Toggle the visibility of velocity labels.Box Velocity Color— Set the color of velocity labels.
Help
The Help section displays keyboard shortcuts and navigation guides.
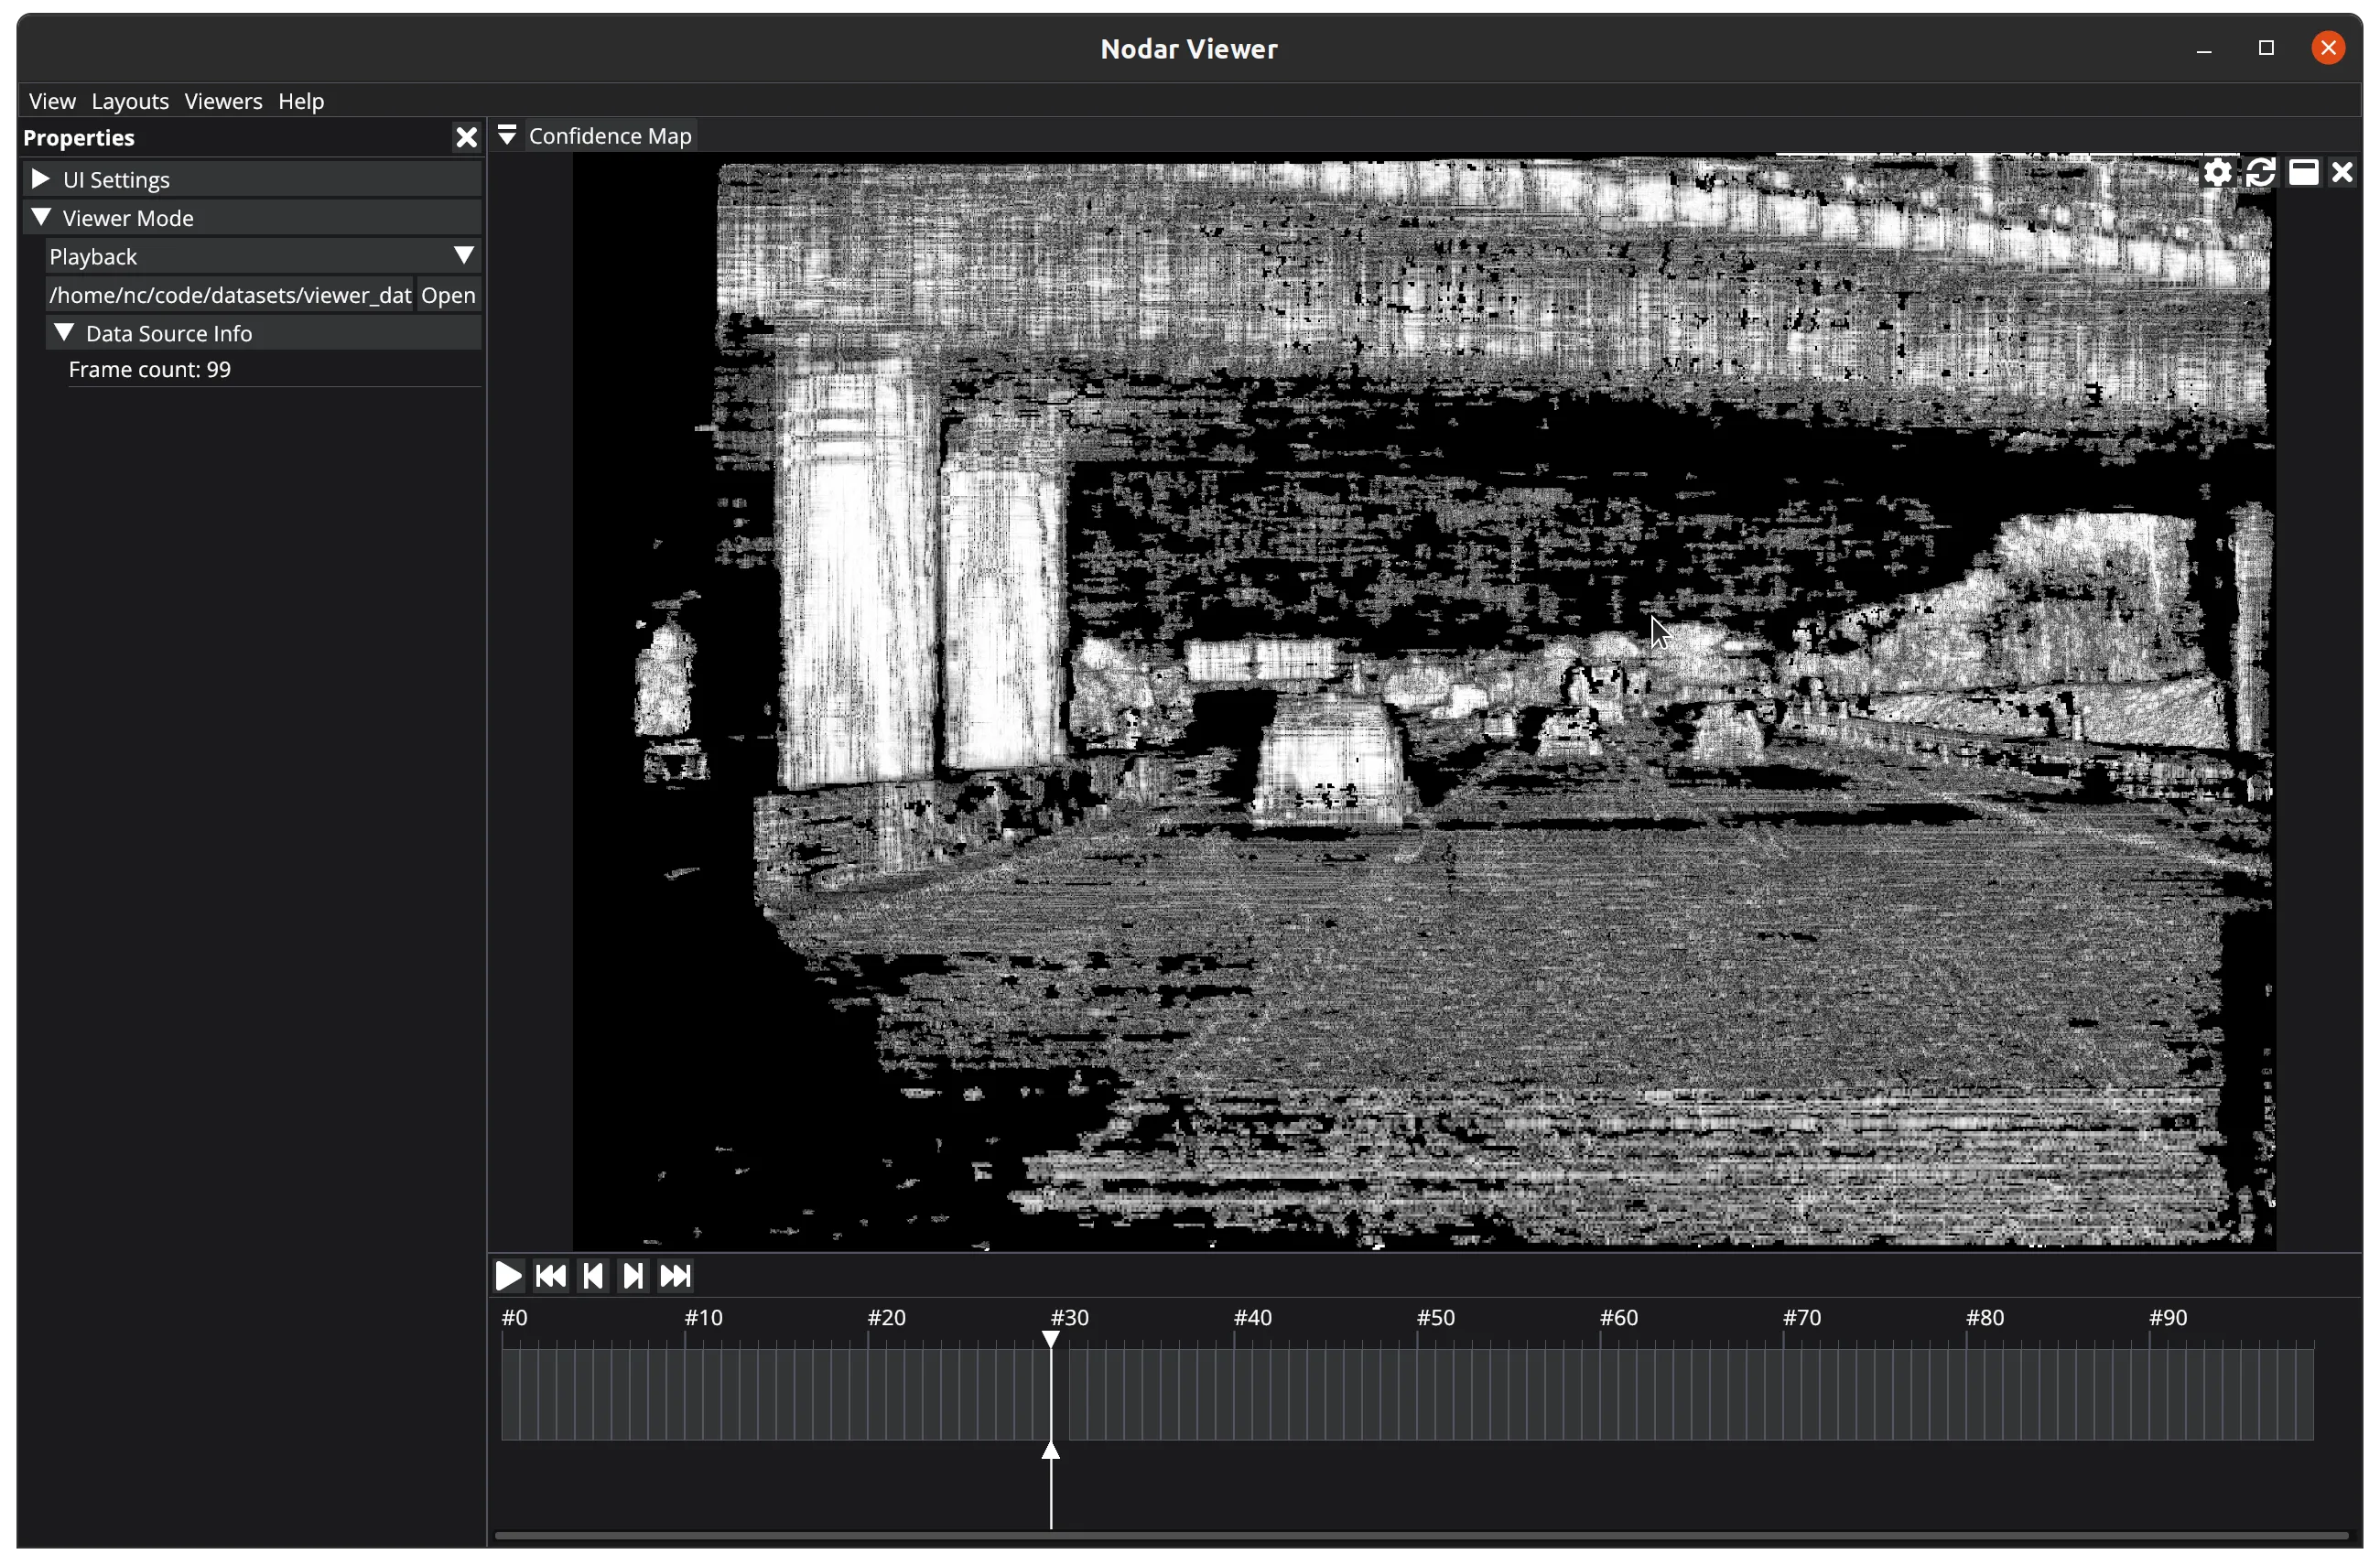
Confidence Map
The Confidence Map viewer indicates how confident the stereo matcher is in finding the best match for each pixel. It calculates this by measuring the difference between the best match's cost and the second-best match's cost, converting this difference into a grayscale value.
For example, when there is a larger difference between the best and second-best match, the confidence map shows a high value, displayed as a bright pixel. In regions where the matching costs are similar between the best and second-best matches — such as areas with low texture like sky, walls, or asphalt — a low confidence value appears as a dark pixel.
This viewer has no properties.
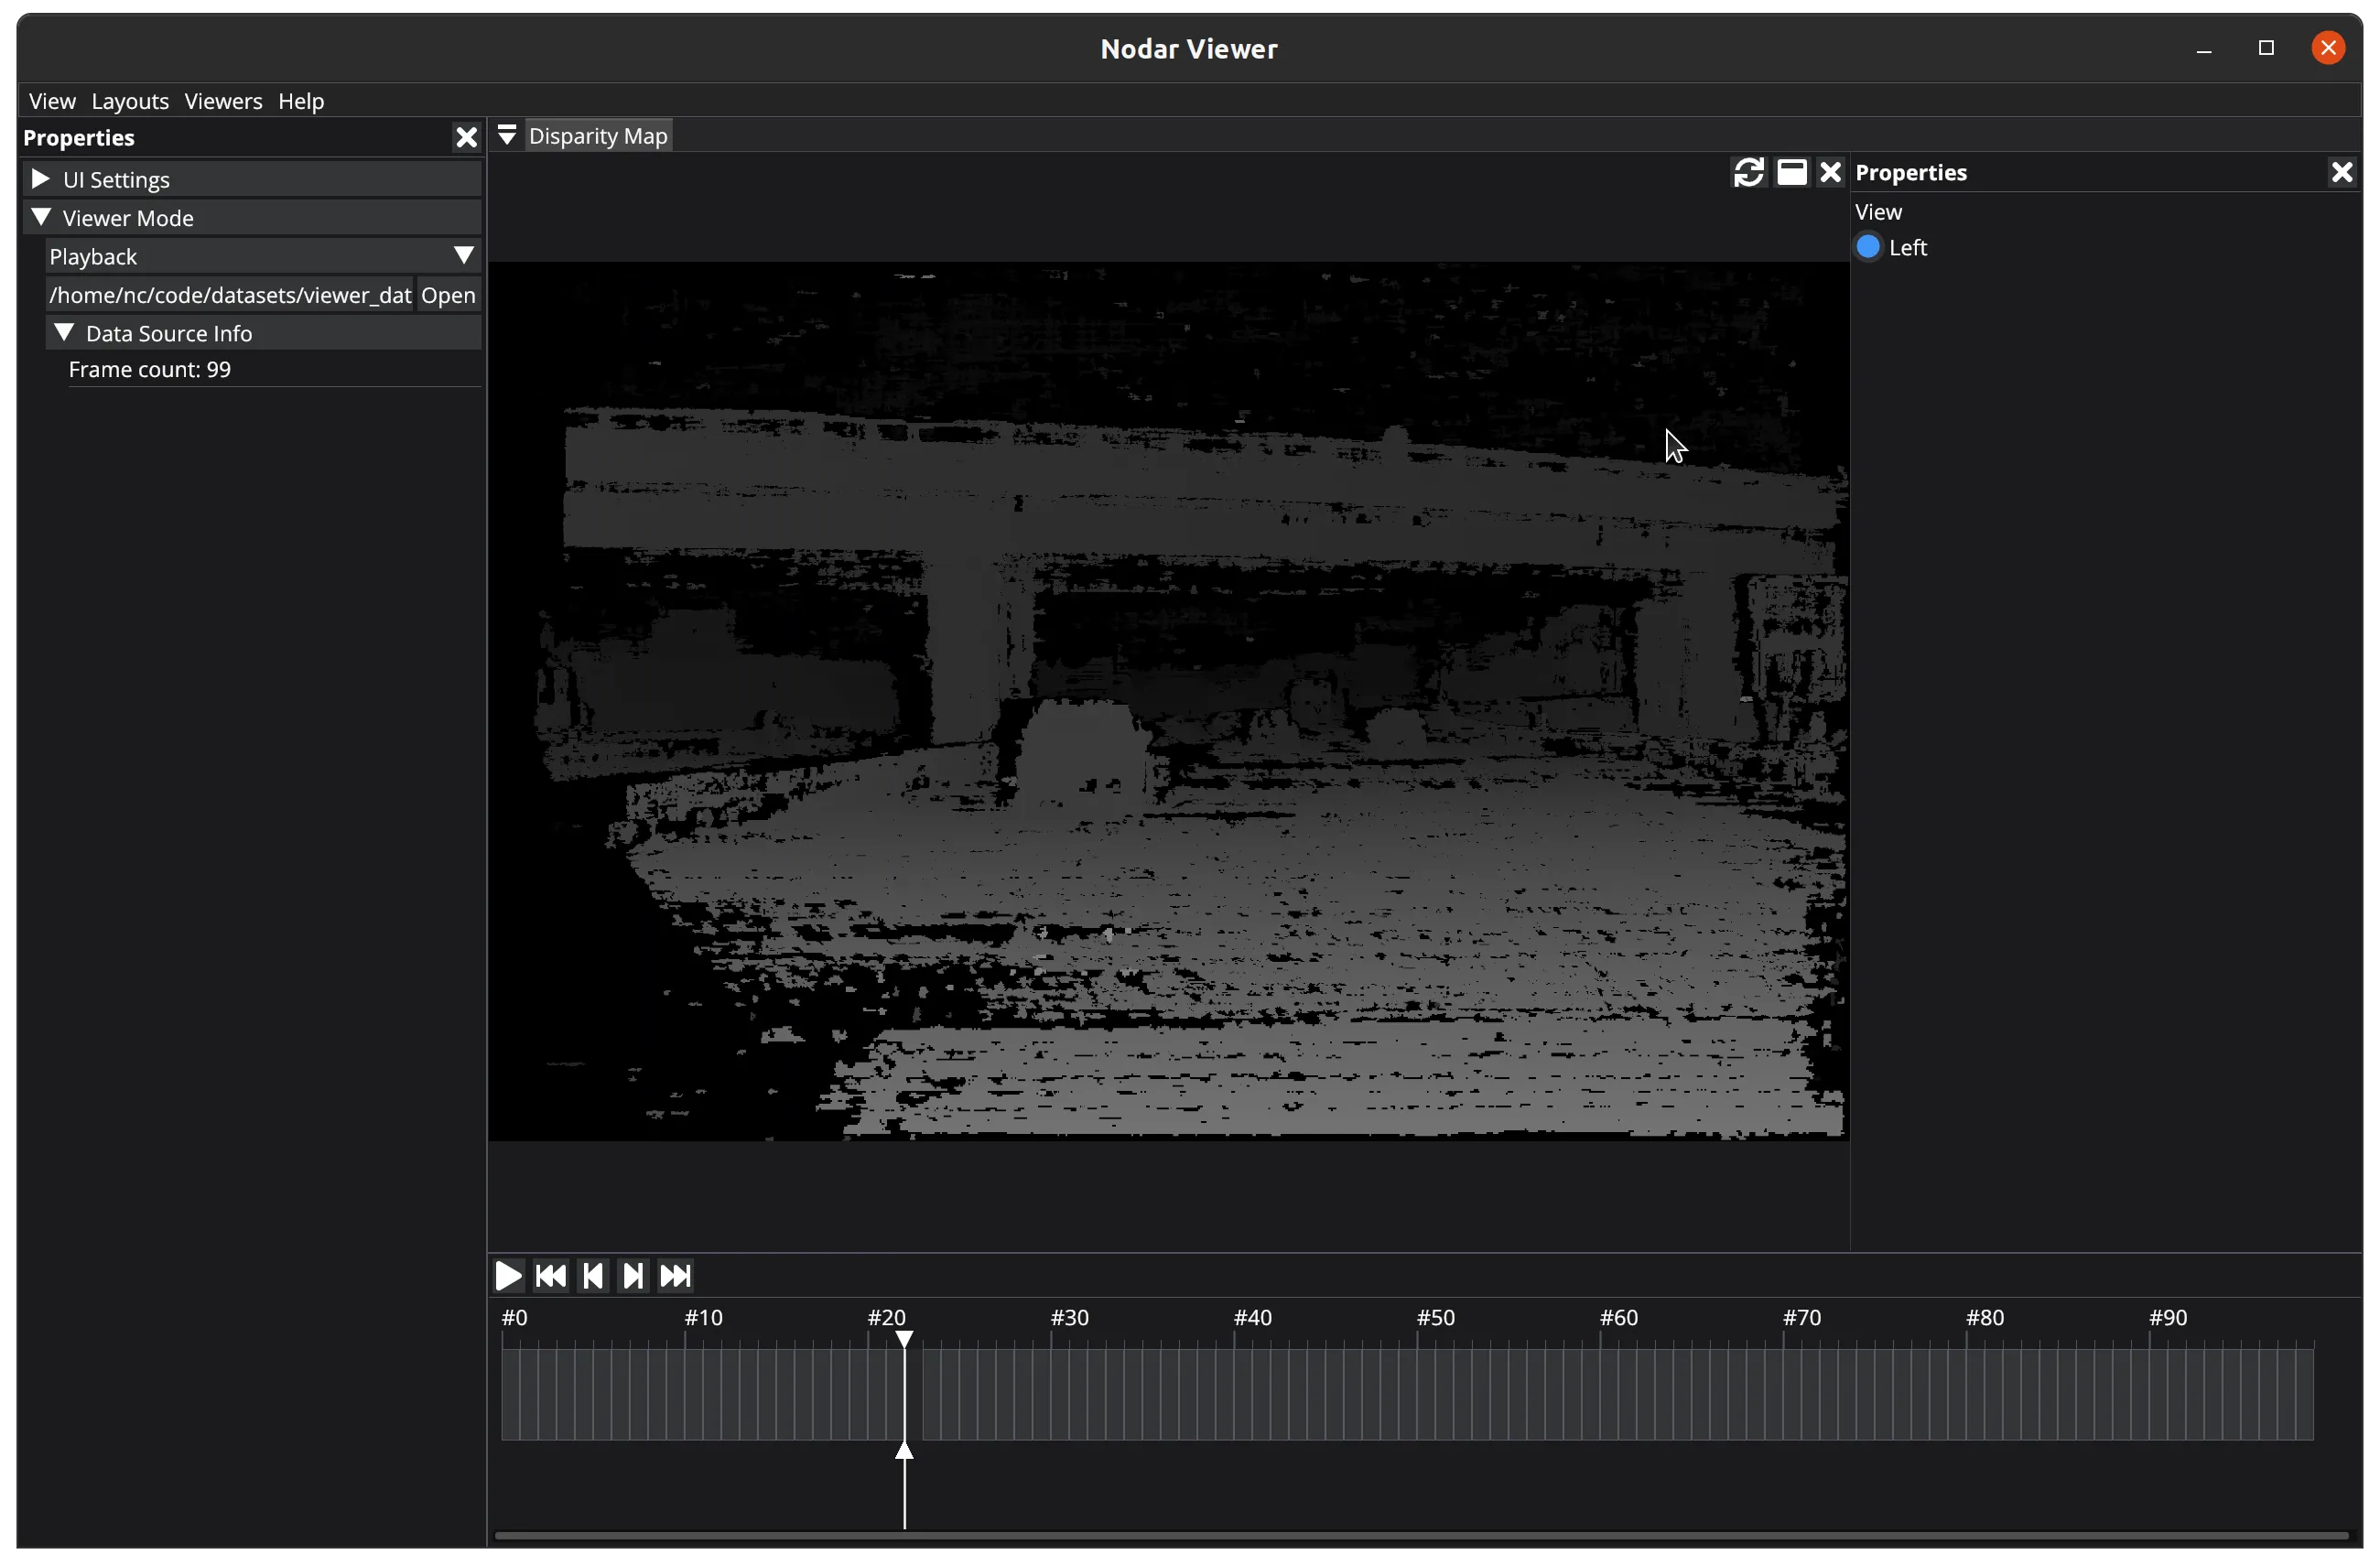
Disparity Map
The Disparity Map viewer displays each pixel's disparity value in grayscale. For HDK systems, only the left disparity image is available.
Dynamic Occupancy Map
The Dynamic Occupancy Map viewer displays detection and tracking module output. This viewer also provides a bird's-eye view of the point cloud, using point density visualization to highlight potential obstacles.
Bounding boxes indicate objects, with colors representing their velocity direction using a color wheel — yellow indicates objects moving toward the sensor, while blue shows objects moving away.
The available properties vary depending on whether the viewer is running in Connection or Playback mode.
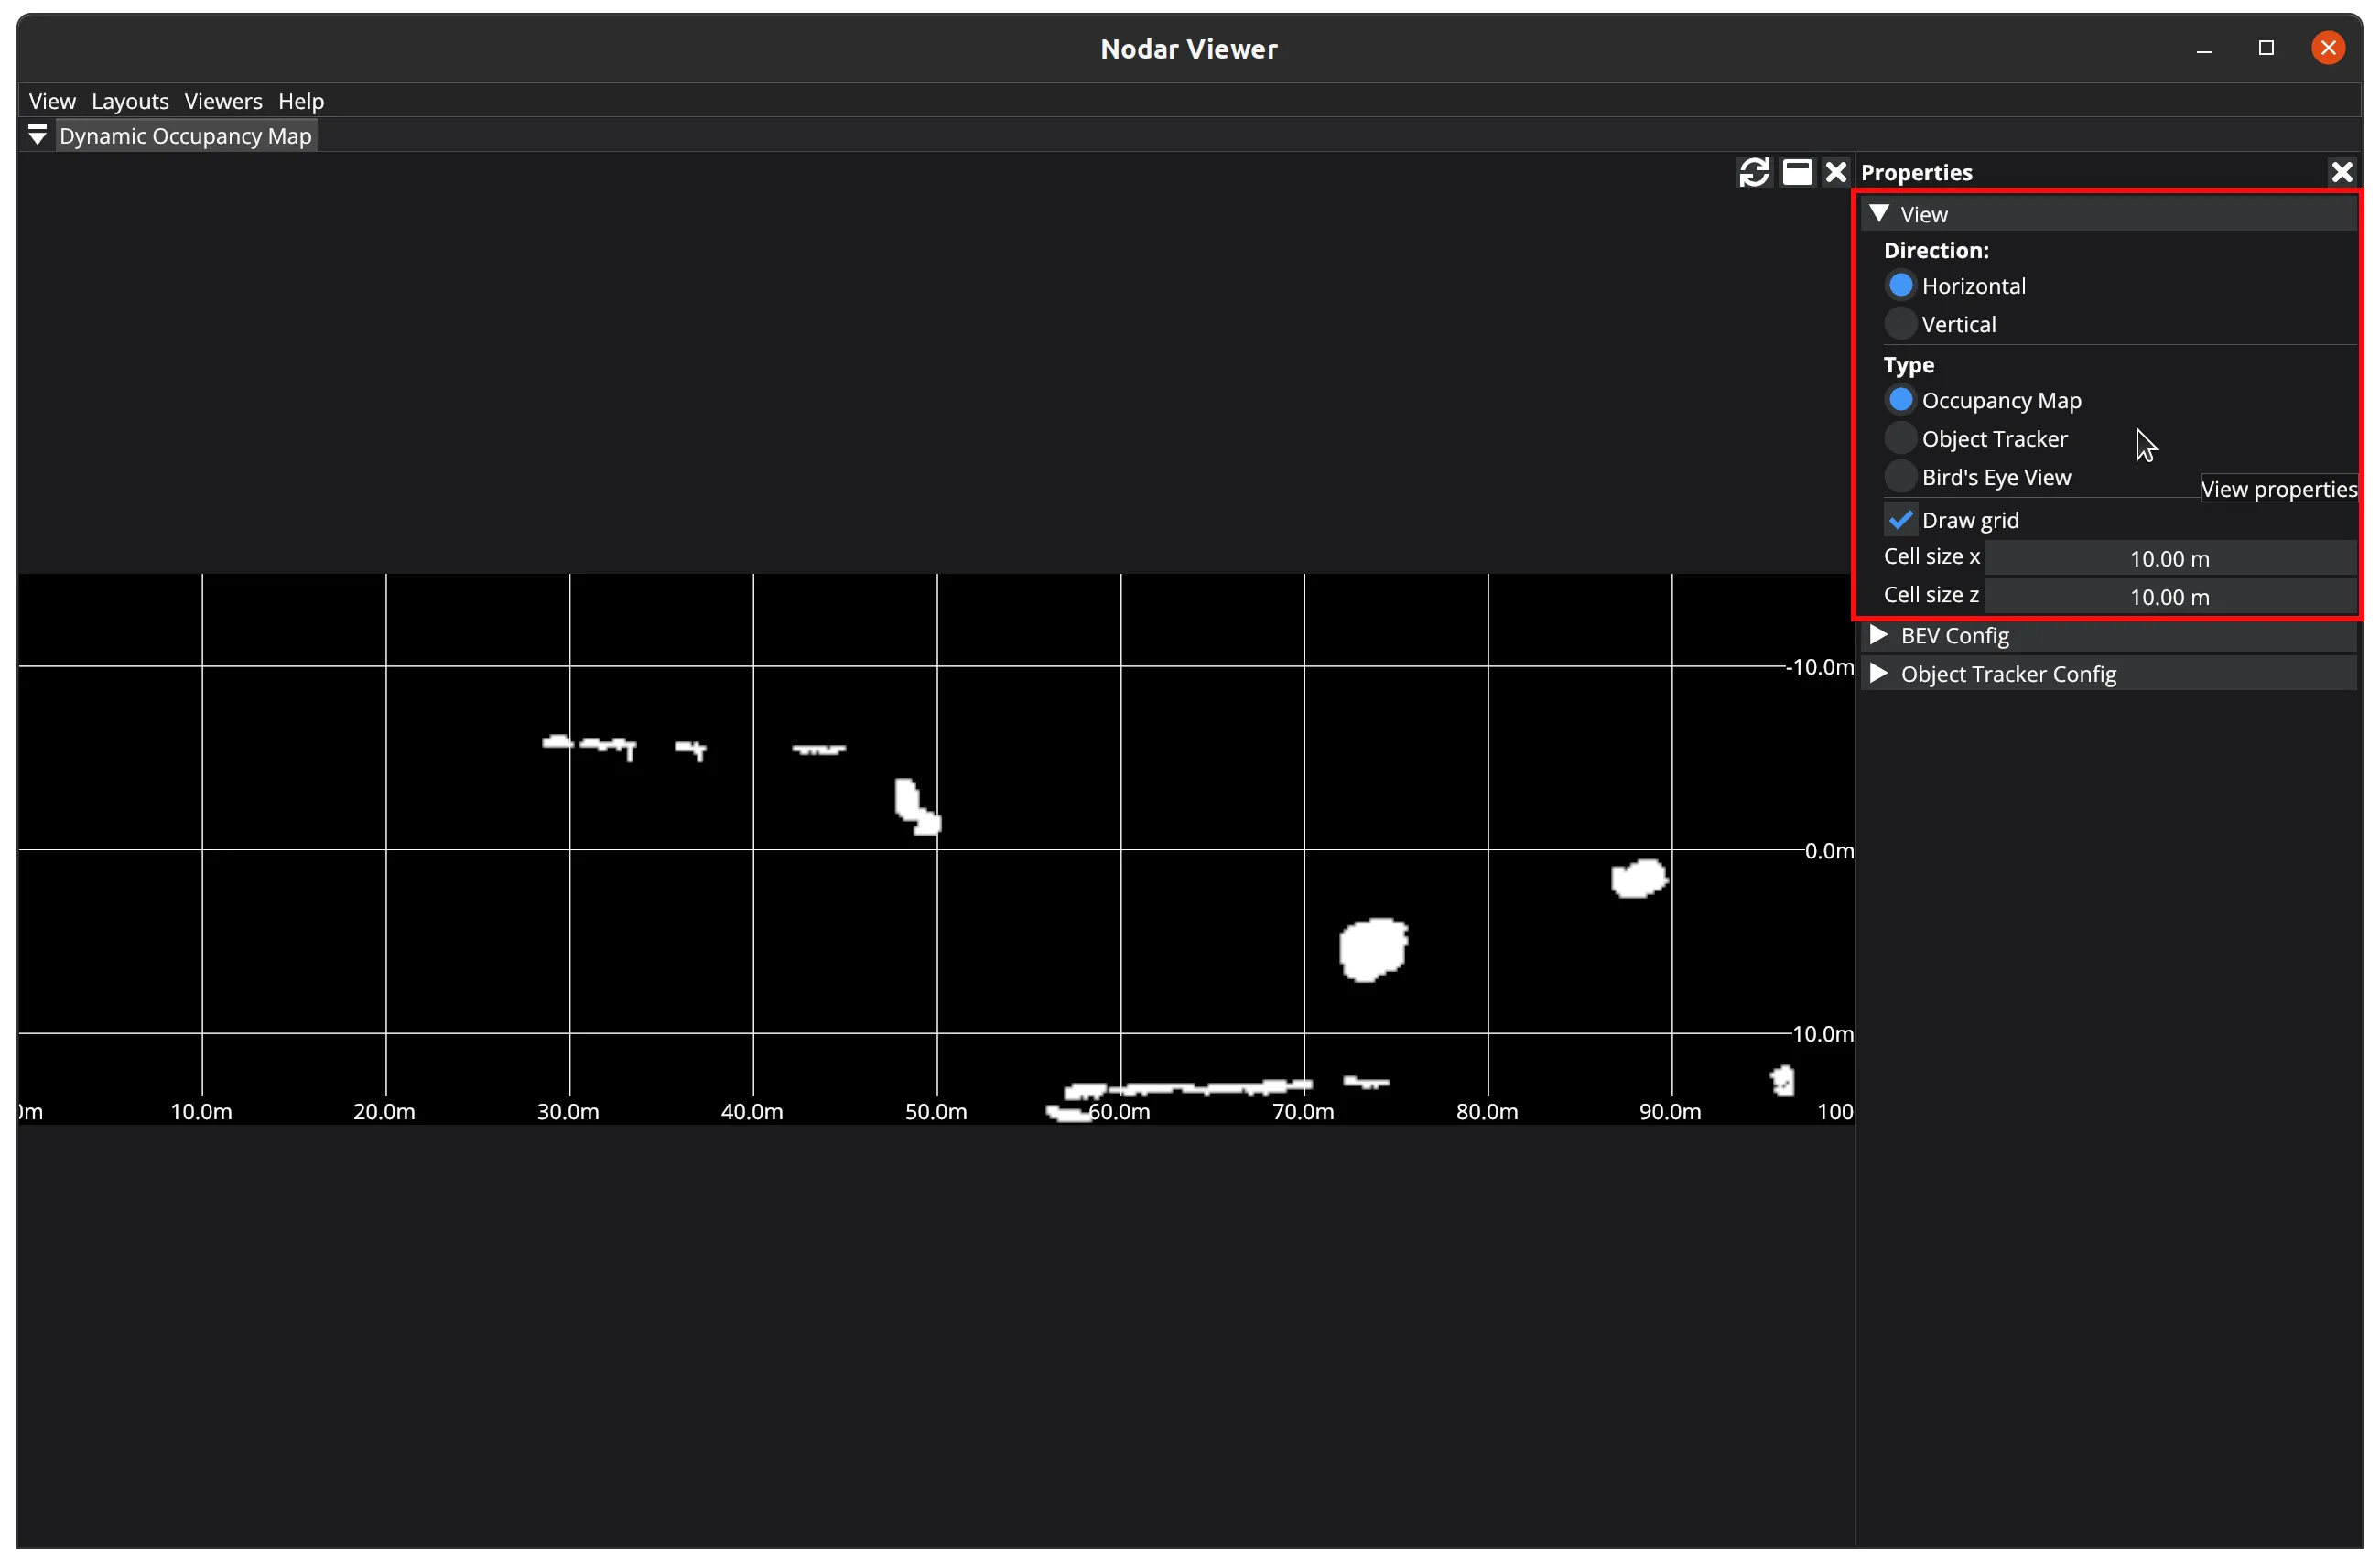
View
The View section works in both Connection and Playback modes, offering these settings:
Direction— Controls the image orientation, allowing eitherHorizontalorVerticaldisplay.Type— One of the following image types:Occupancy Map— A binary one-channel 8-bit image where occupied cells are displayed with a color value of 255.Object Tracker— An image displaying detected objects, with each object's color indicating its velocity.Bird's Eye View— A top-down visualization of the point cloud data.
Draw Grid— Toggle the grid overlay display.Cell size xandCell size z— Set the dimensions of overlay grid cells. Note: Thezaxis represents the horizontal direction when image direction isHorizontal, and the vertical direction when image direction isVertical.
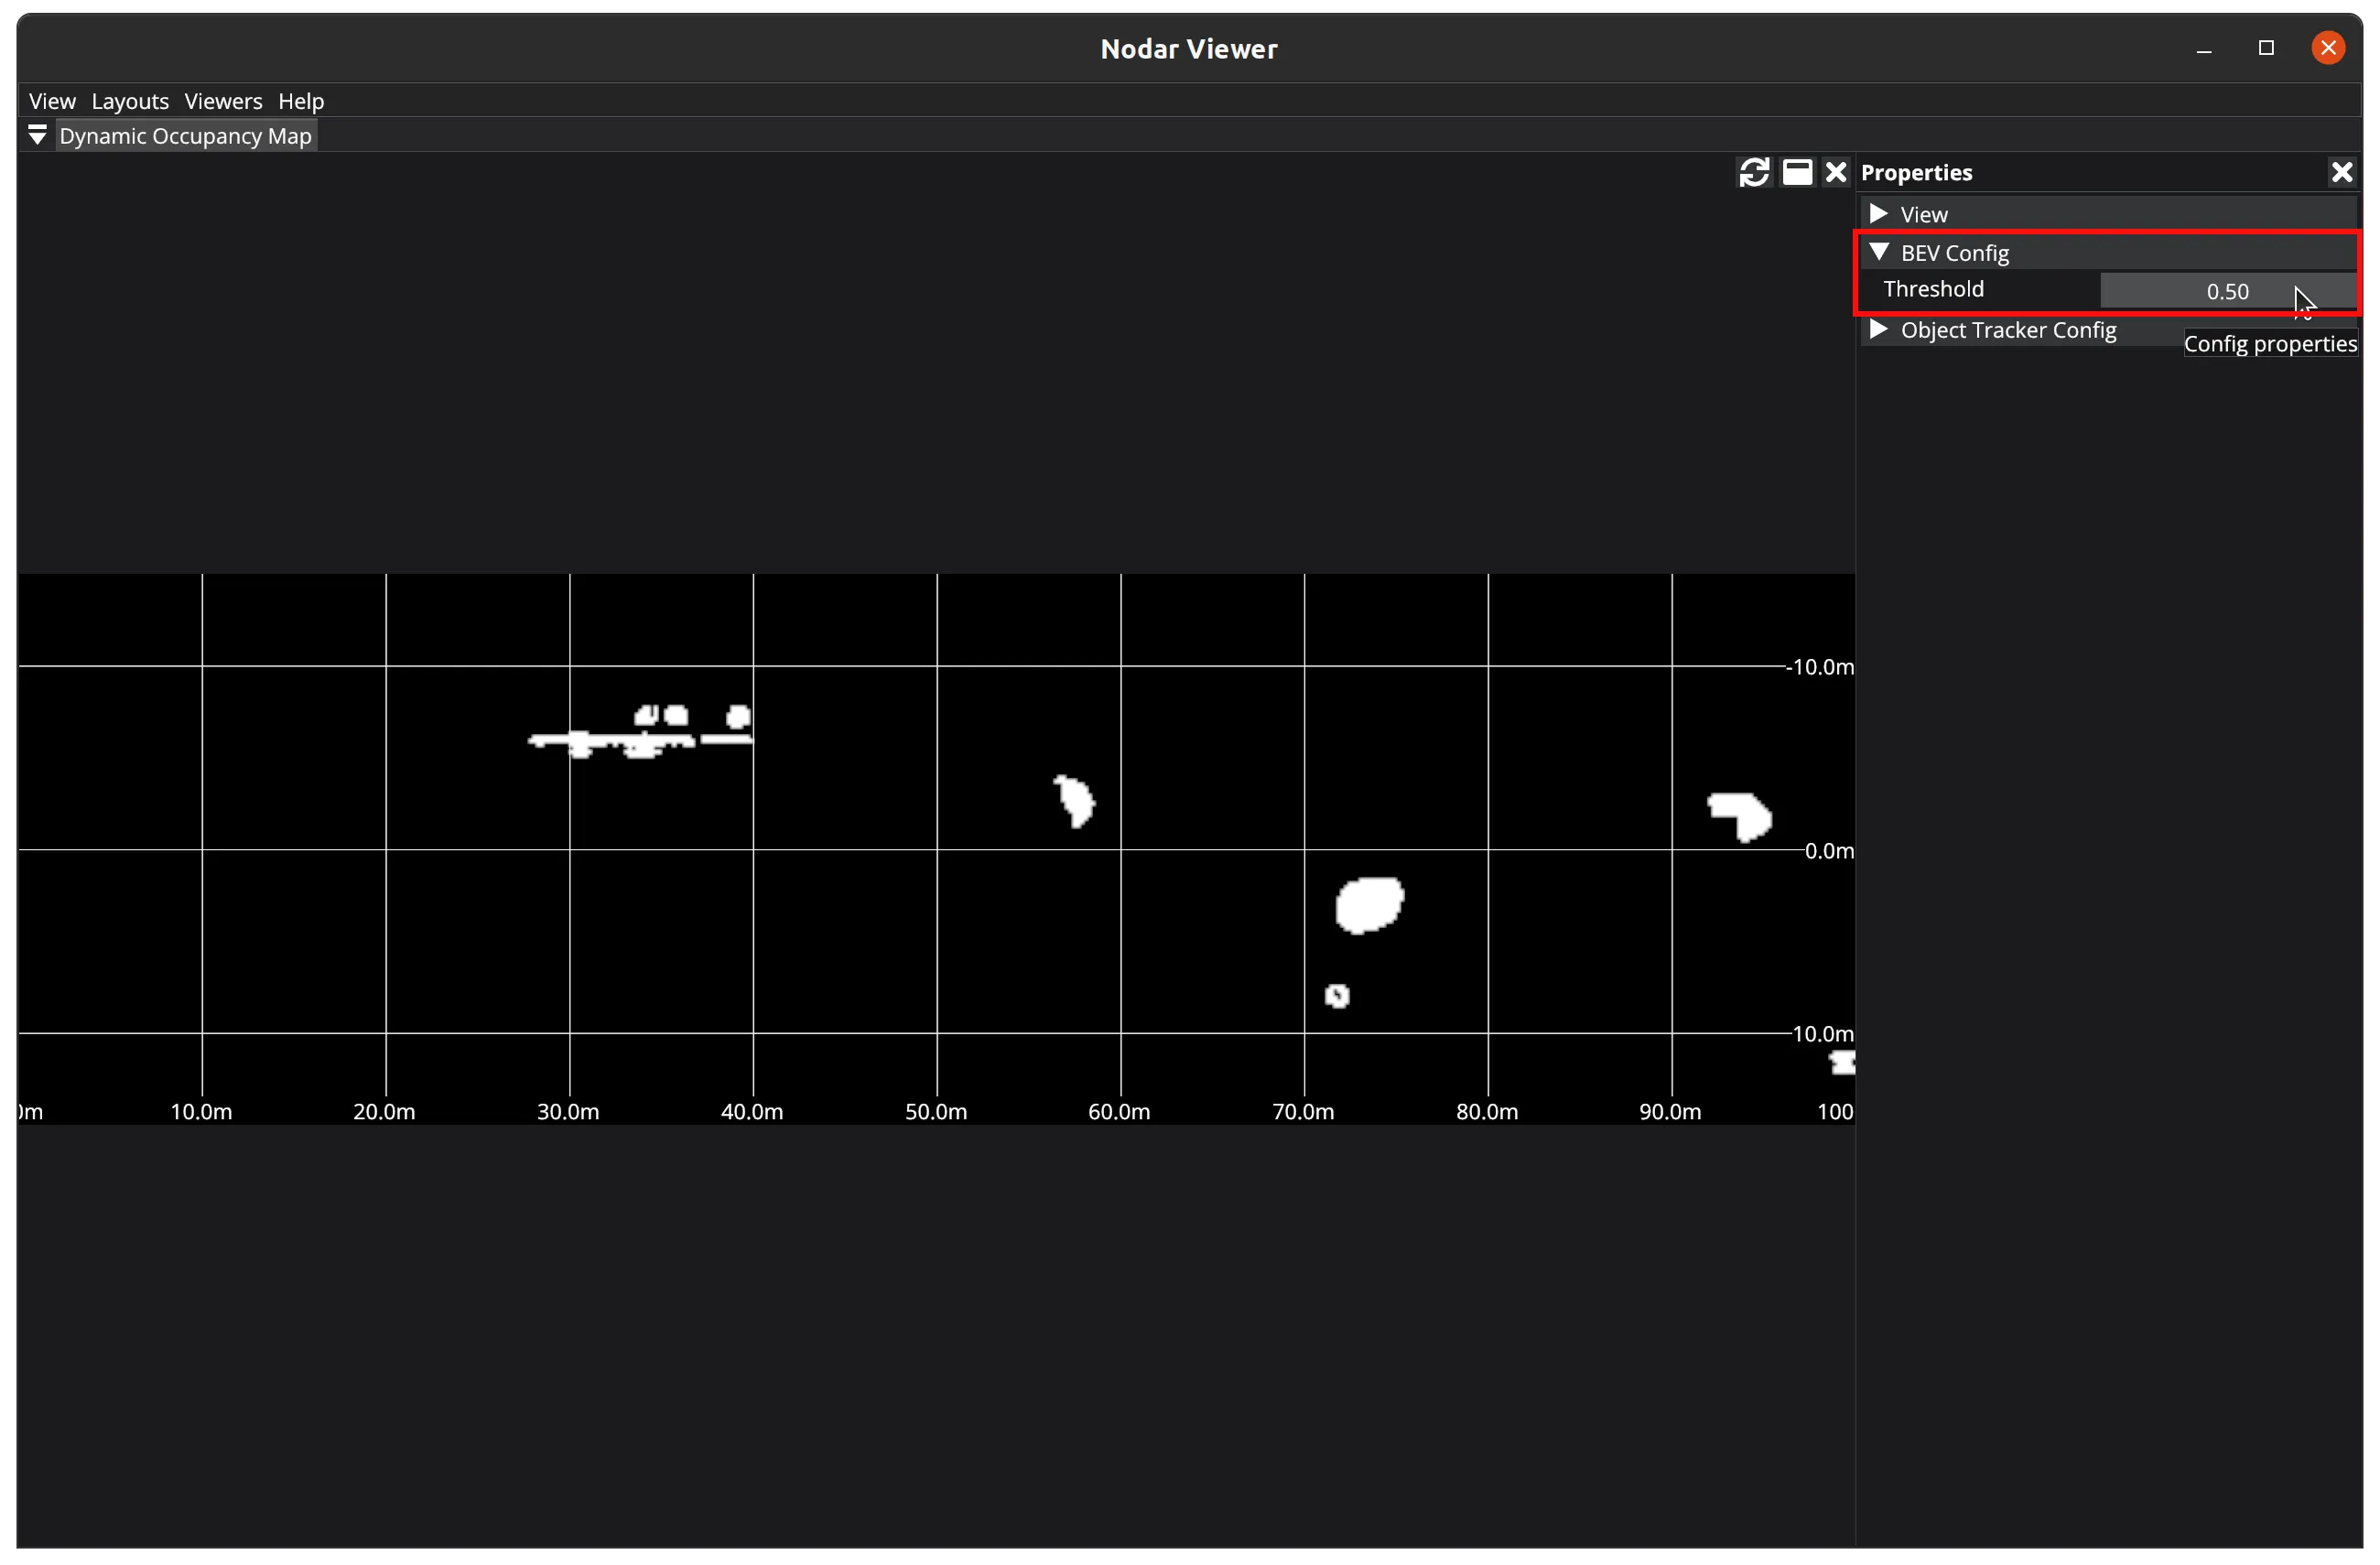
BEV Config
This section appears only when connected in Connection mode. It provides the following setting:
Threshold— Controls the sensitivity of obstacle detection in the Grid Detect output. Increasing the threshold reduces false positives but may also reduce the number of true detections.
Note
This section appears only when Hammerhead is launched with the obstacle detector enabled.
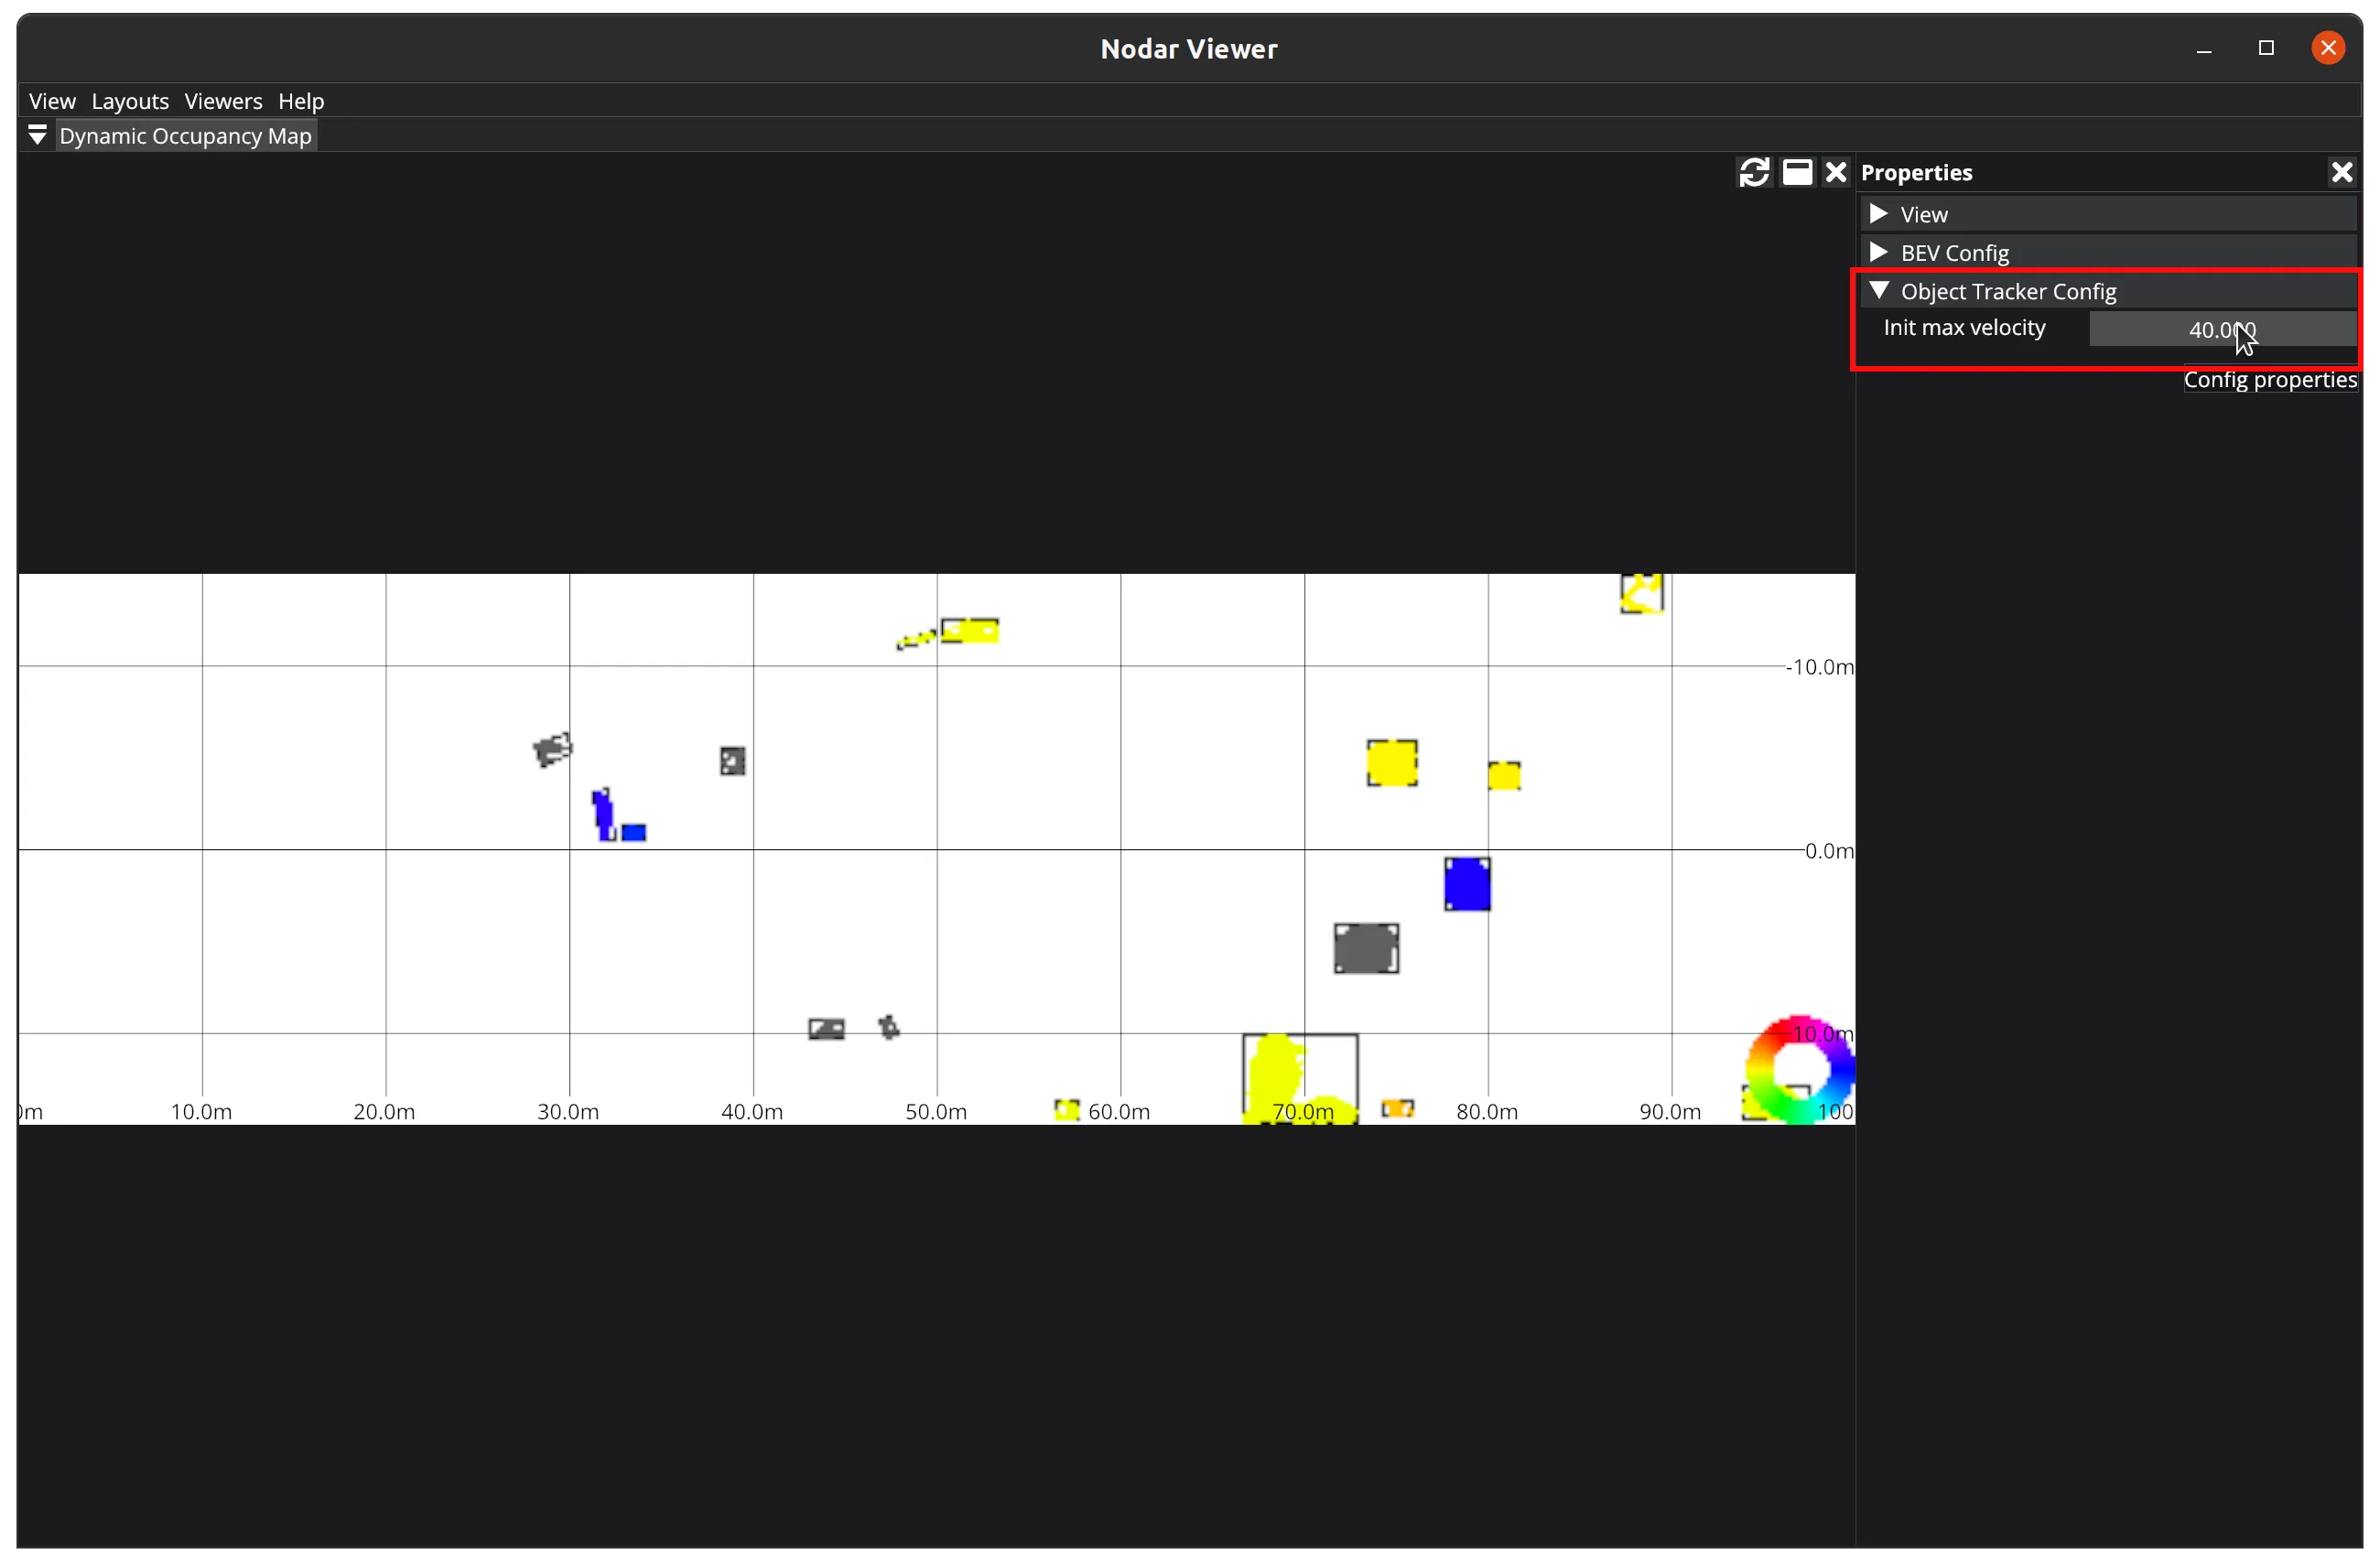
Object Tracker Config
This section appears only when connected in Connection mode. It provides the following setting:
Init max velocity— Corresponds to the maximum speed at which objects move relative to the camera. For example, in a static setup with vehicles moving at 50 m/s, the user should setInit max velocityto 50.0.
Note
This section appears only when Hammerhead is launched with the obstacle detector enabled.
Initial Calibration
The Initial Calibration viewer allows you to specify settings for camera calibration. Once submitted, Hammerhead launches a calibration process based on these settings.
Three types of calibration are available: Factory Calibration, Refine Calibration, and Range Calibration.
Note: This viewer is only active when connected in Connection mode.
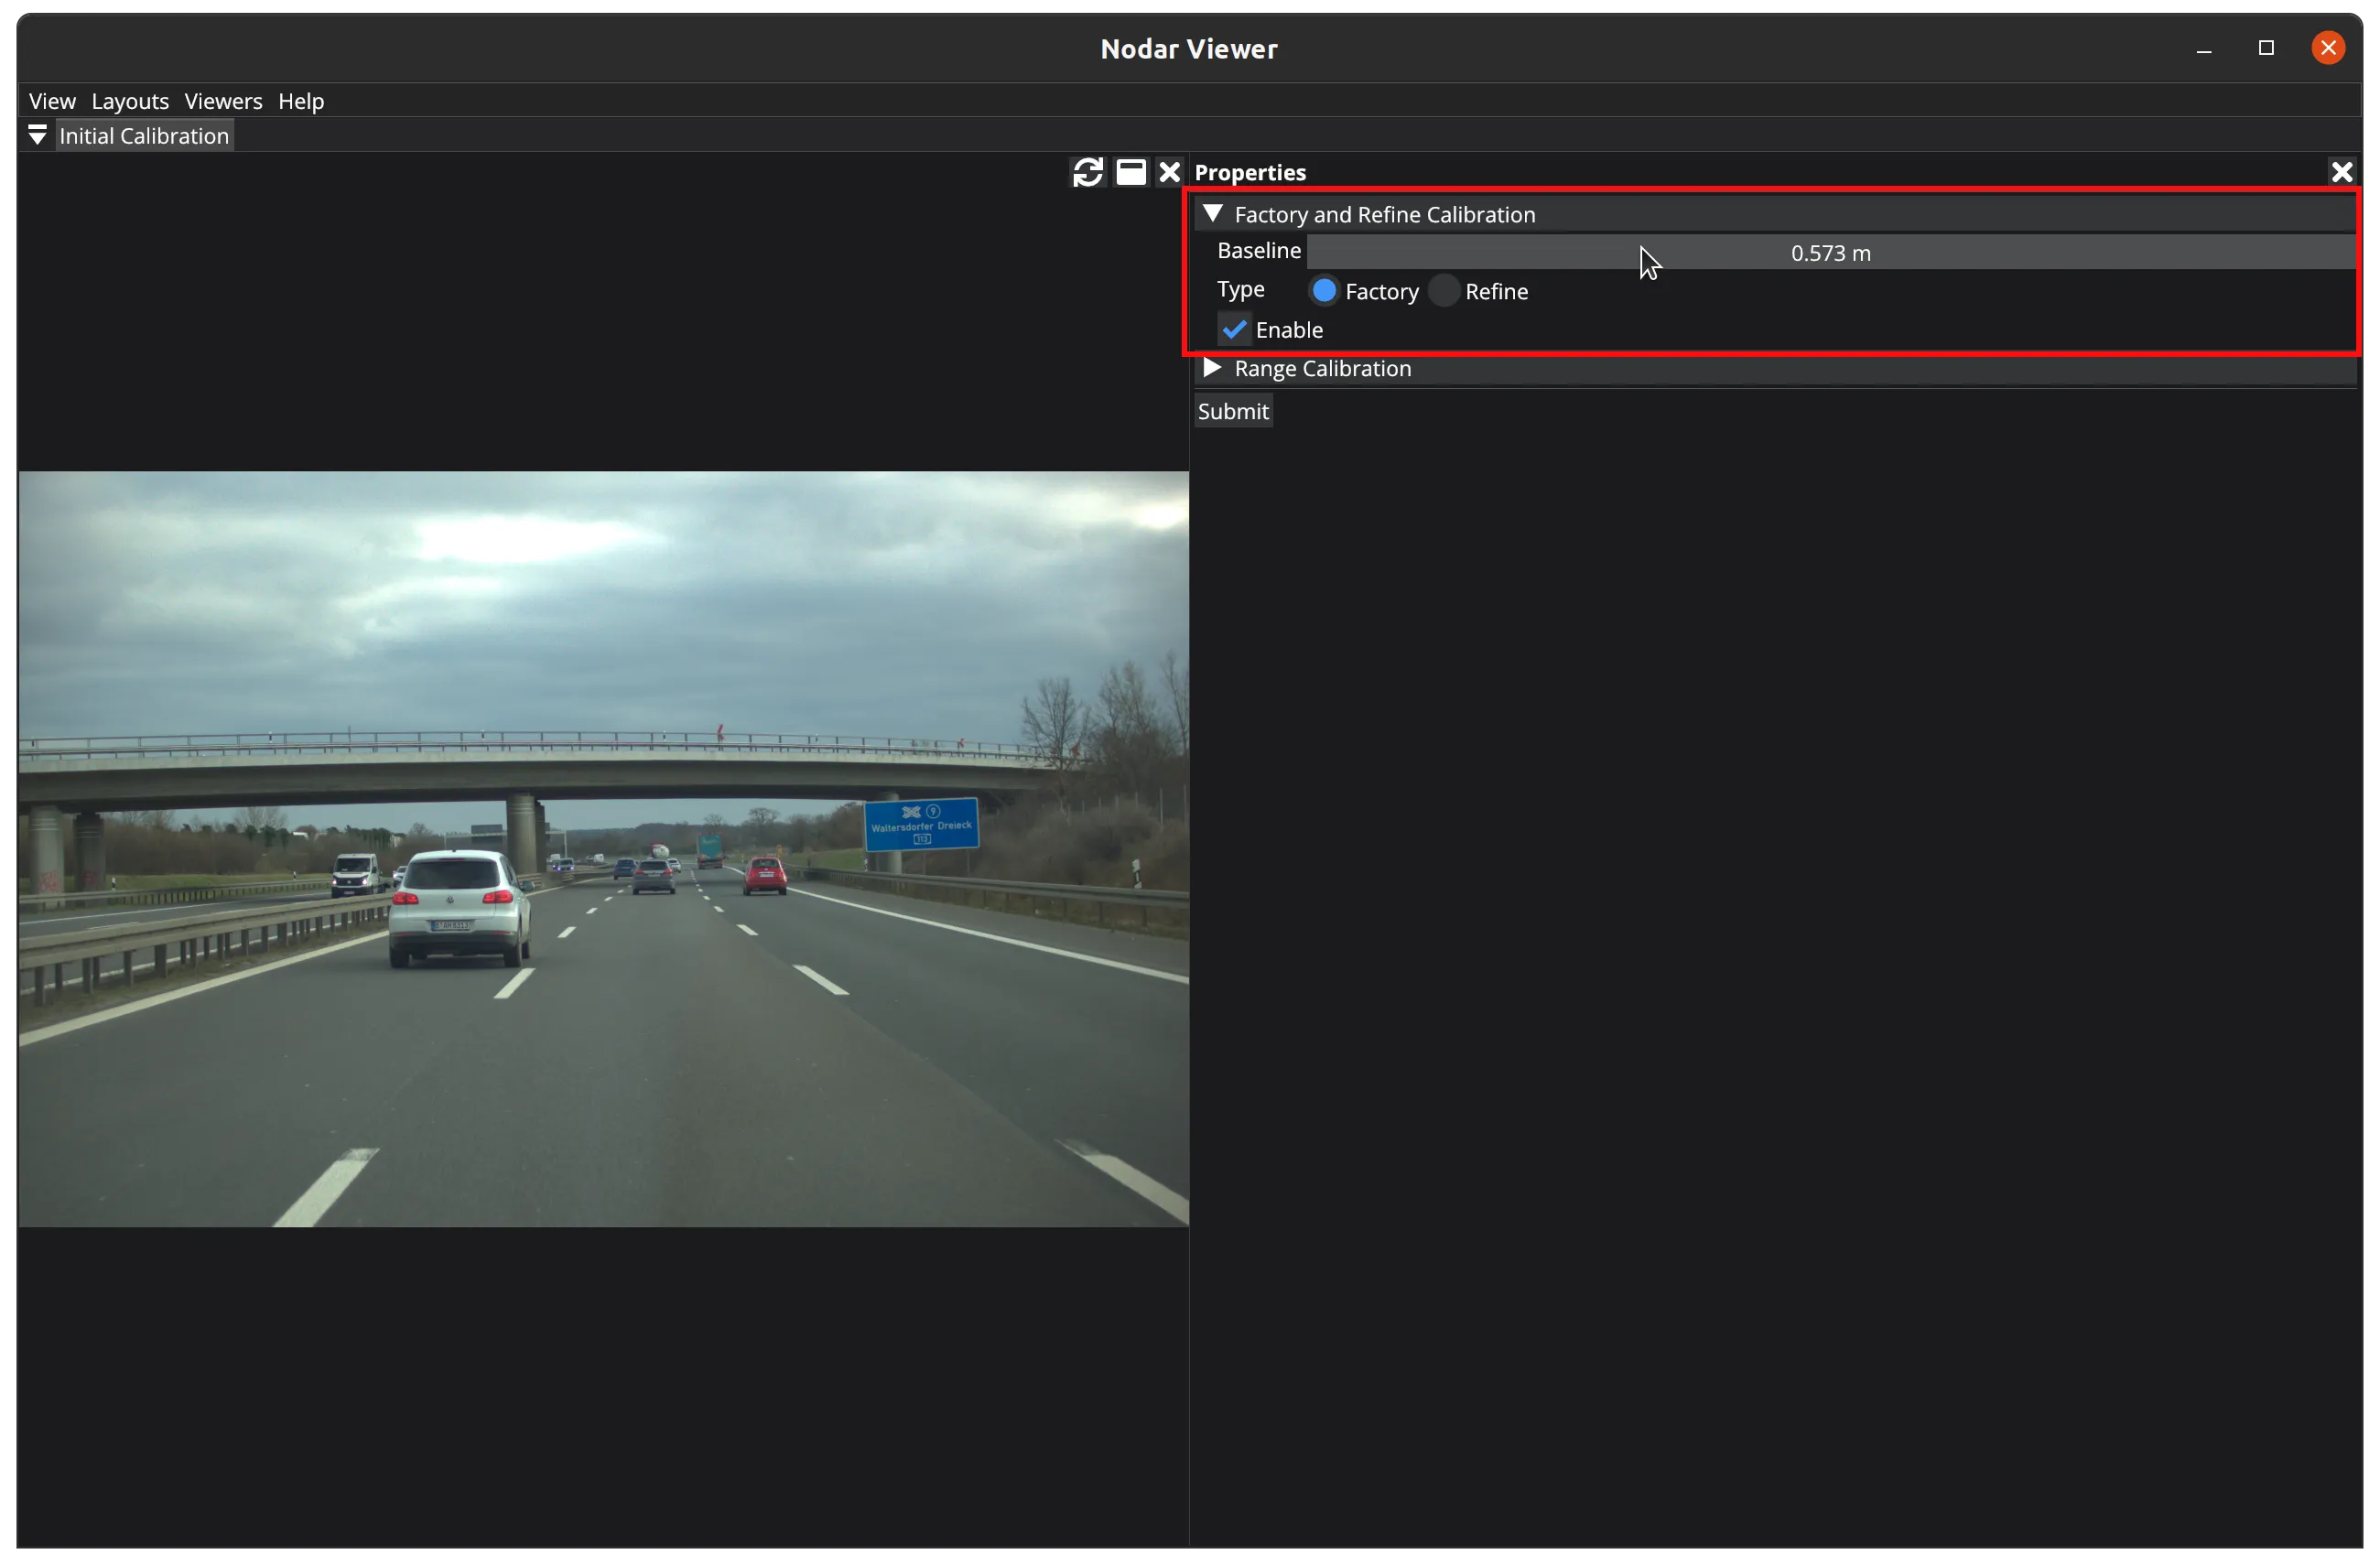
Factory Calibration and Refine Calibration
To use either calibration type, first enable it by clicking the Enable checkbox. Then select your desired calibration type.
Use Factory Calibration when cameras are first mounted to determine their precise positioning. This calibration process can correct angular misalignments up to 3 degrees, though it requires more time to complete.
Run Refine Calibration periodically as part of regular maintenance to maintain optimal alignment. This calibration type corrects small angular shifts of up to 1 degree, ensuring the system stays precise over time.
The following parameters are available:
Baseline— The distance between cameras, measured in meters.
Range Calibration
To begin range calibration, click the Add Region button to create a region. You can create up to 16 regions.
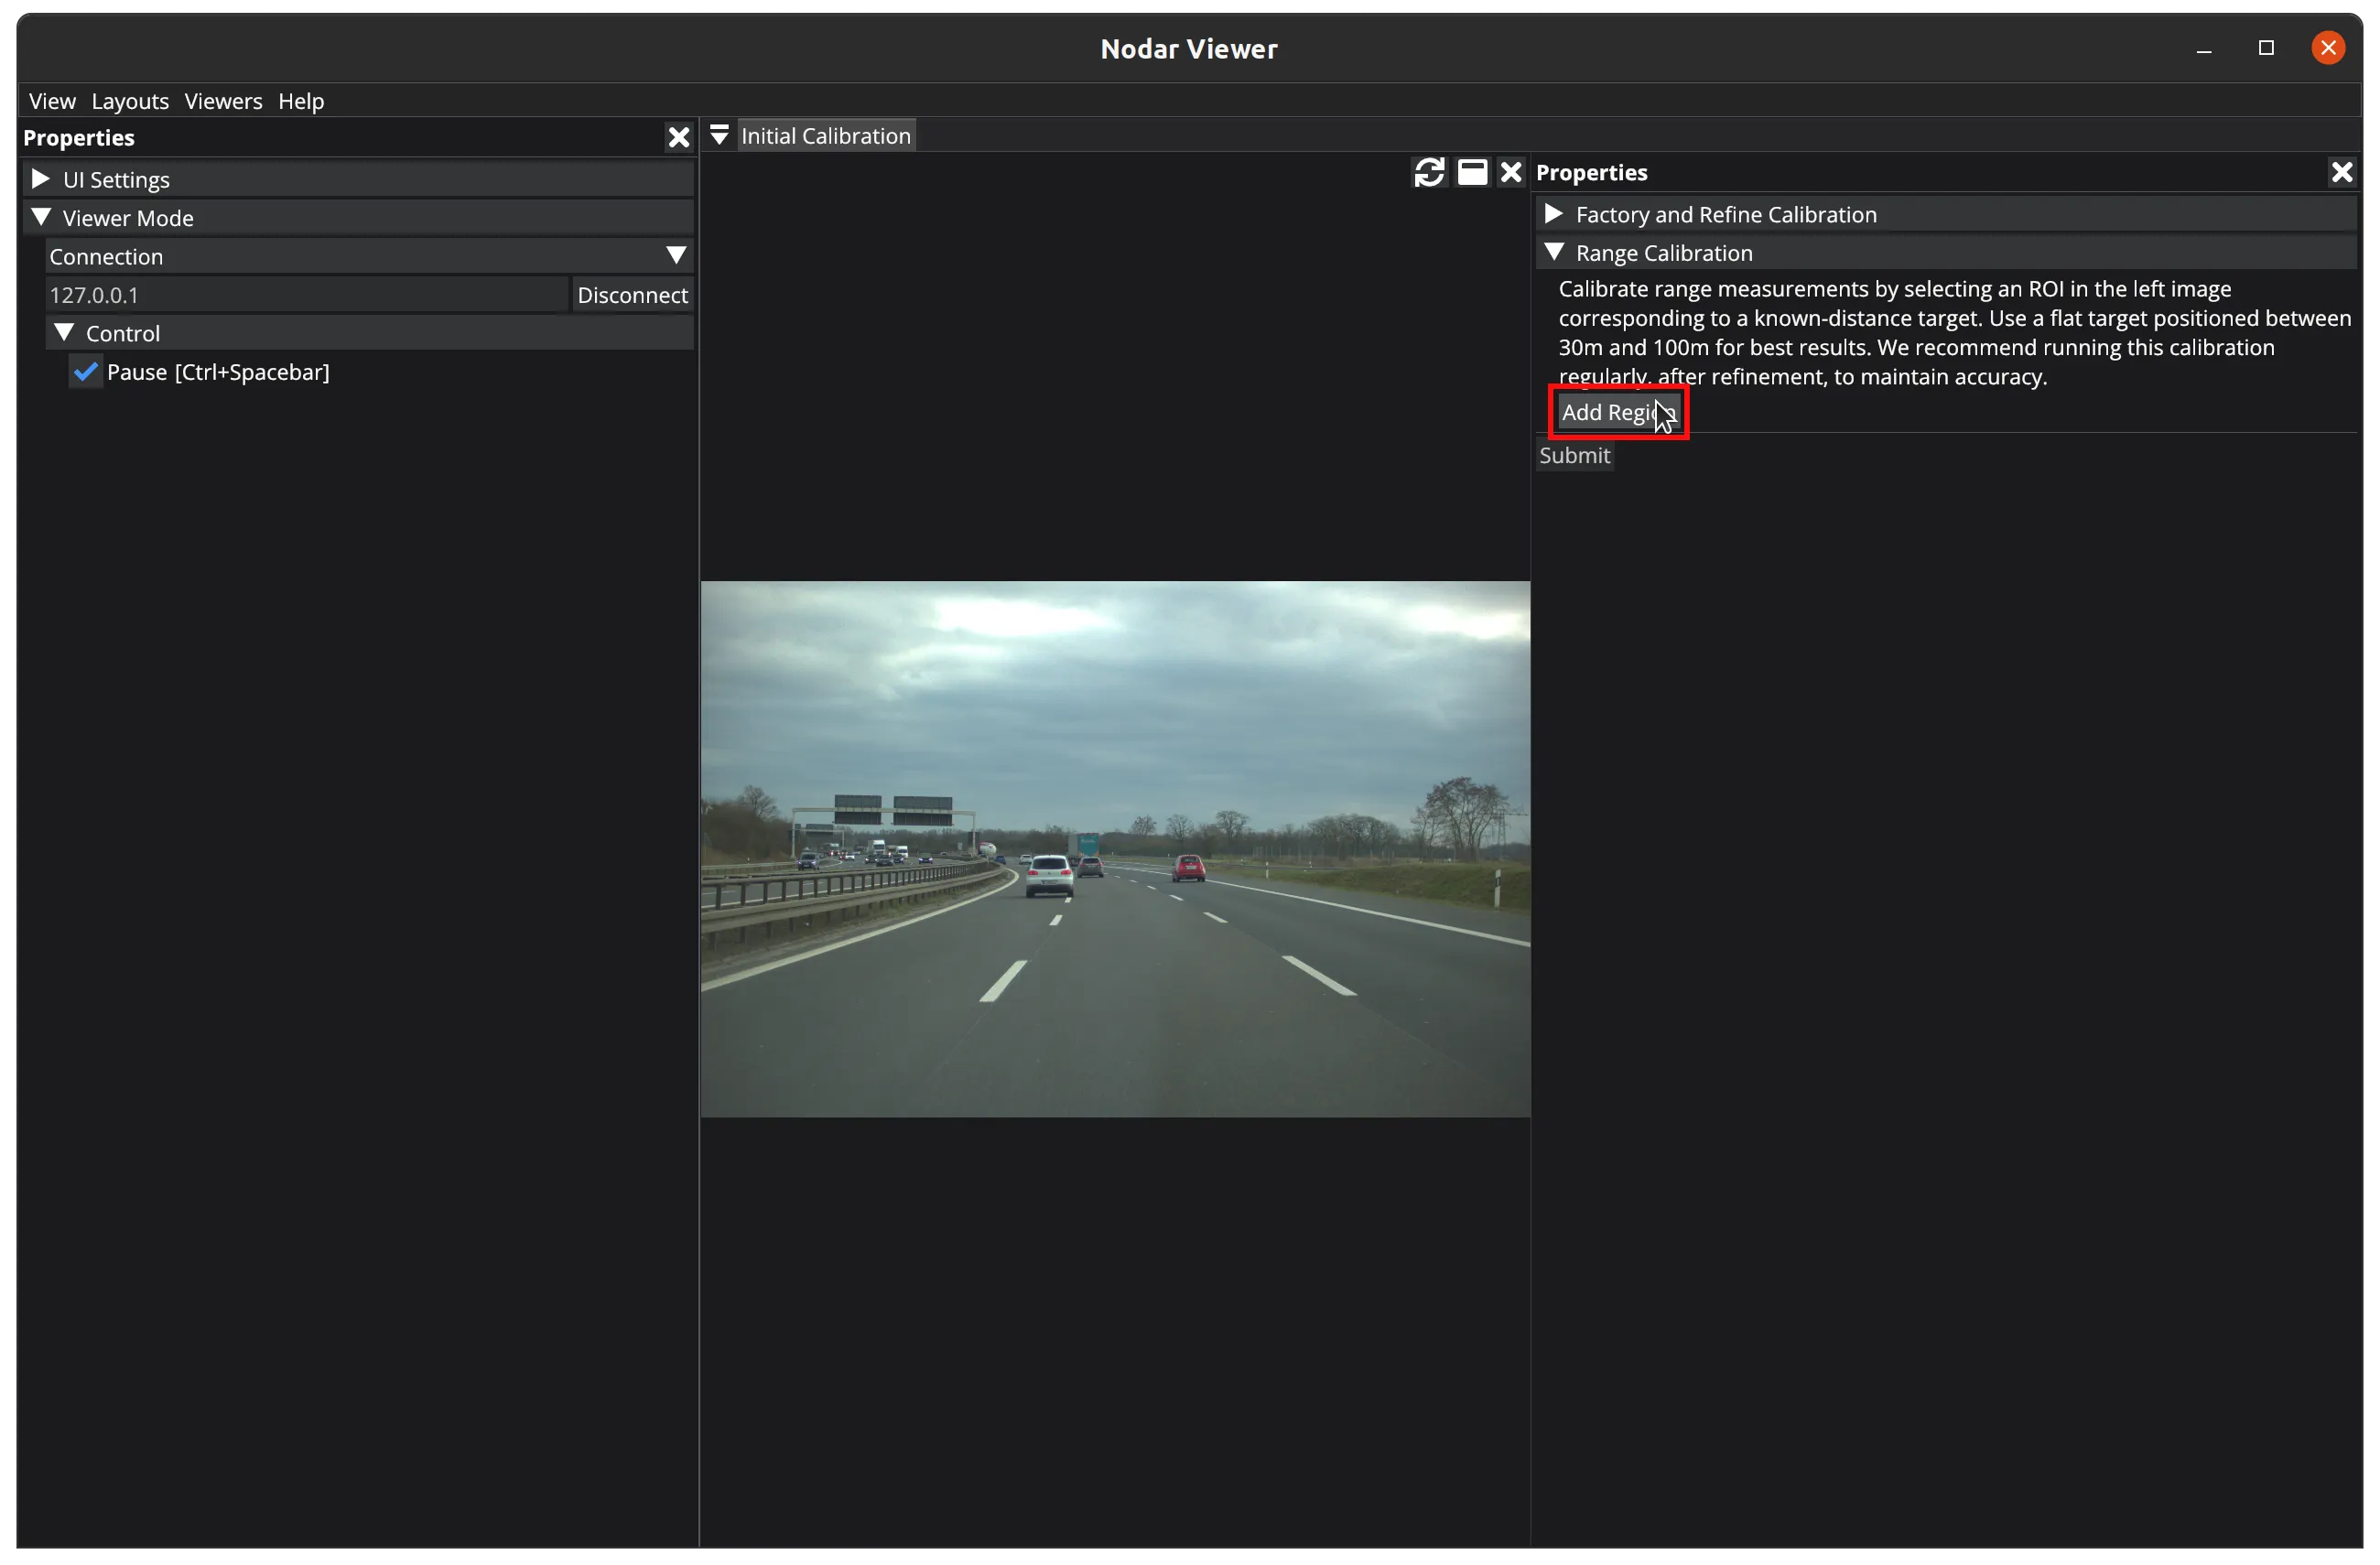
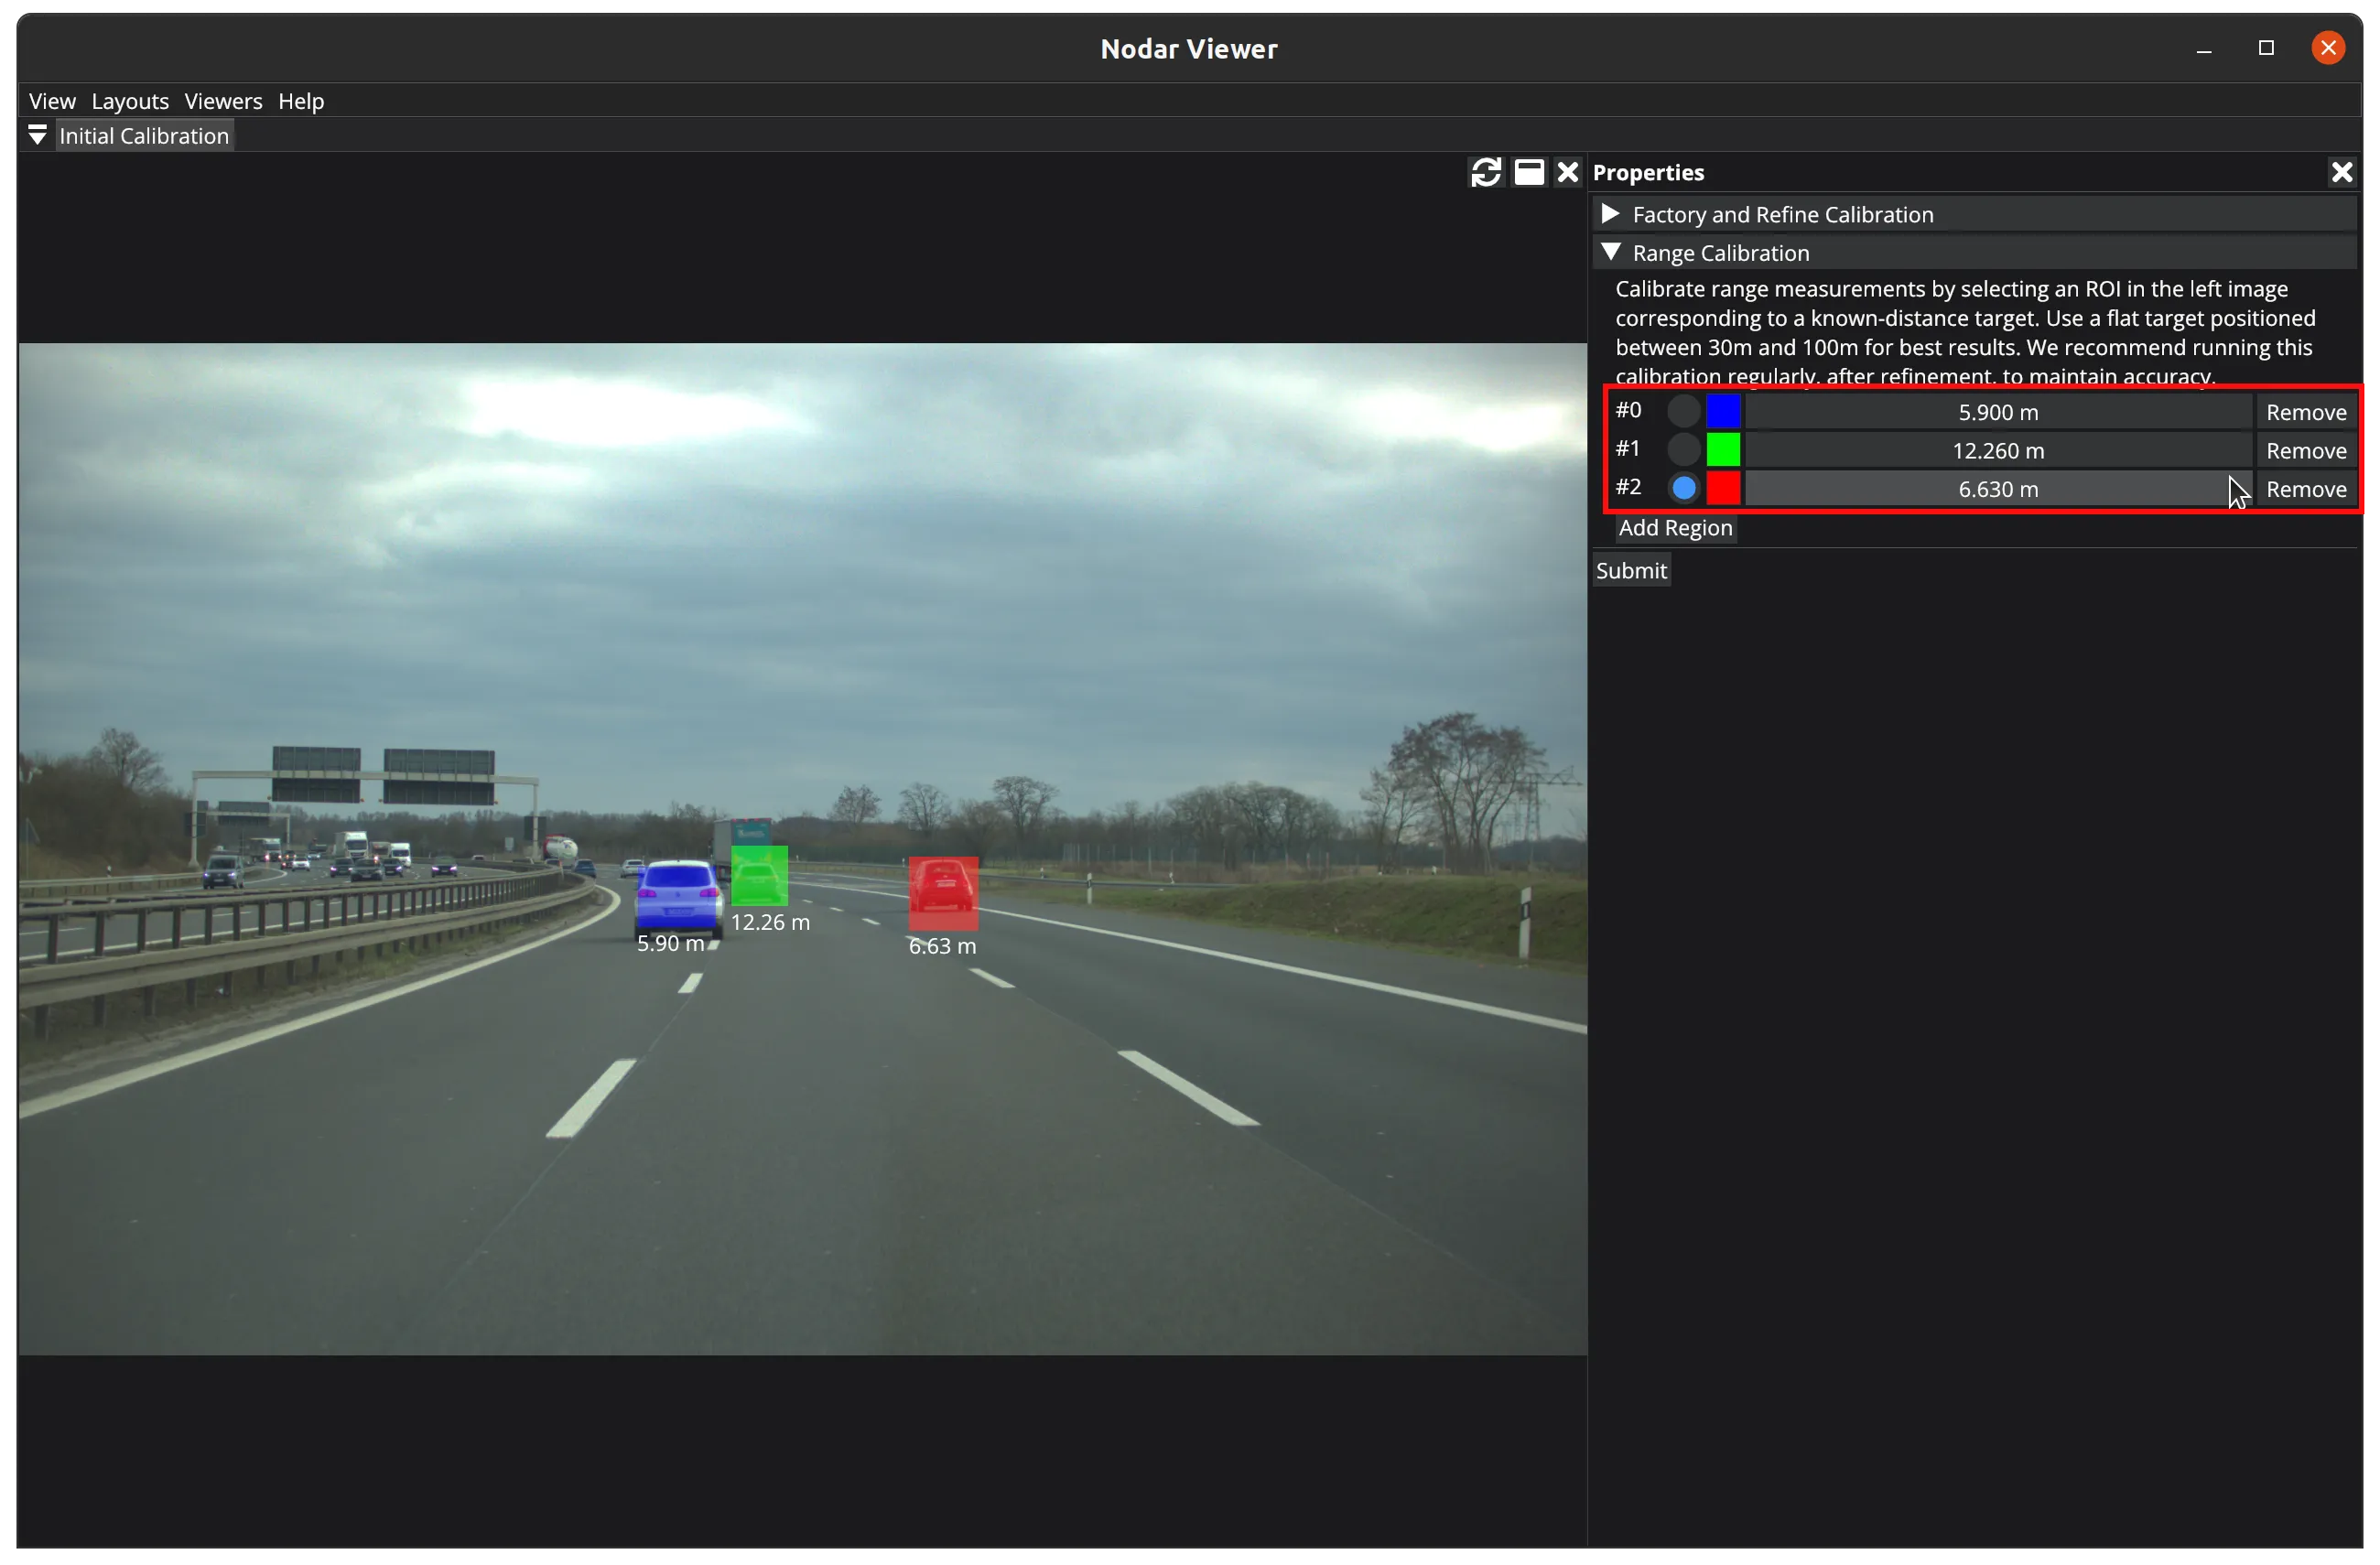
After adding a region, draw a rectangular region of interest on the image containing a target at a known distance. For best results, use a flat target positioned between 30m and 100m away. To maintain accuracy, perform this calibration regularly after running Refine Calibration. You can modify an existing region by selecting its radio button, or remove it using the Remove button on the right.
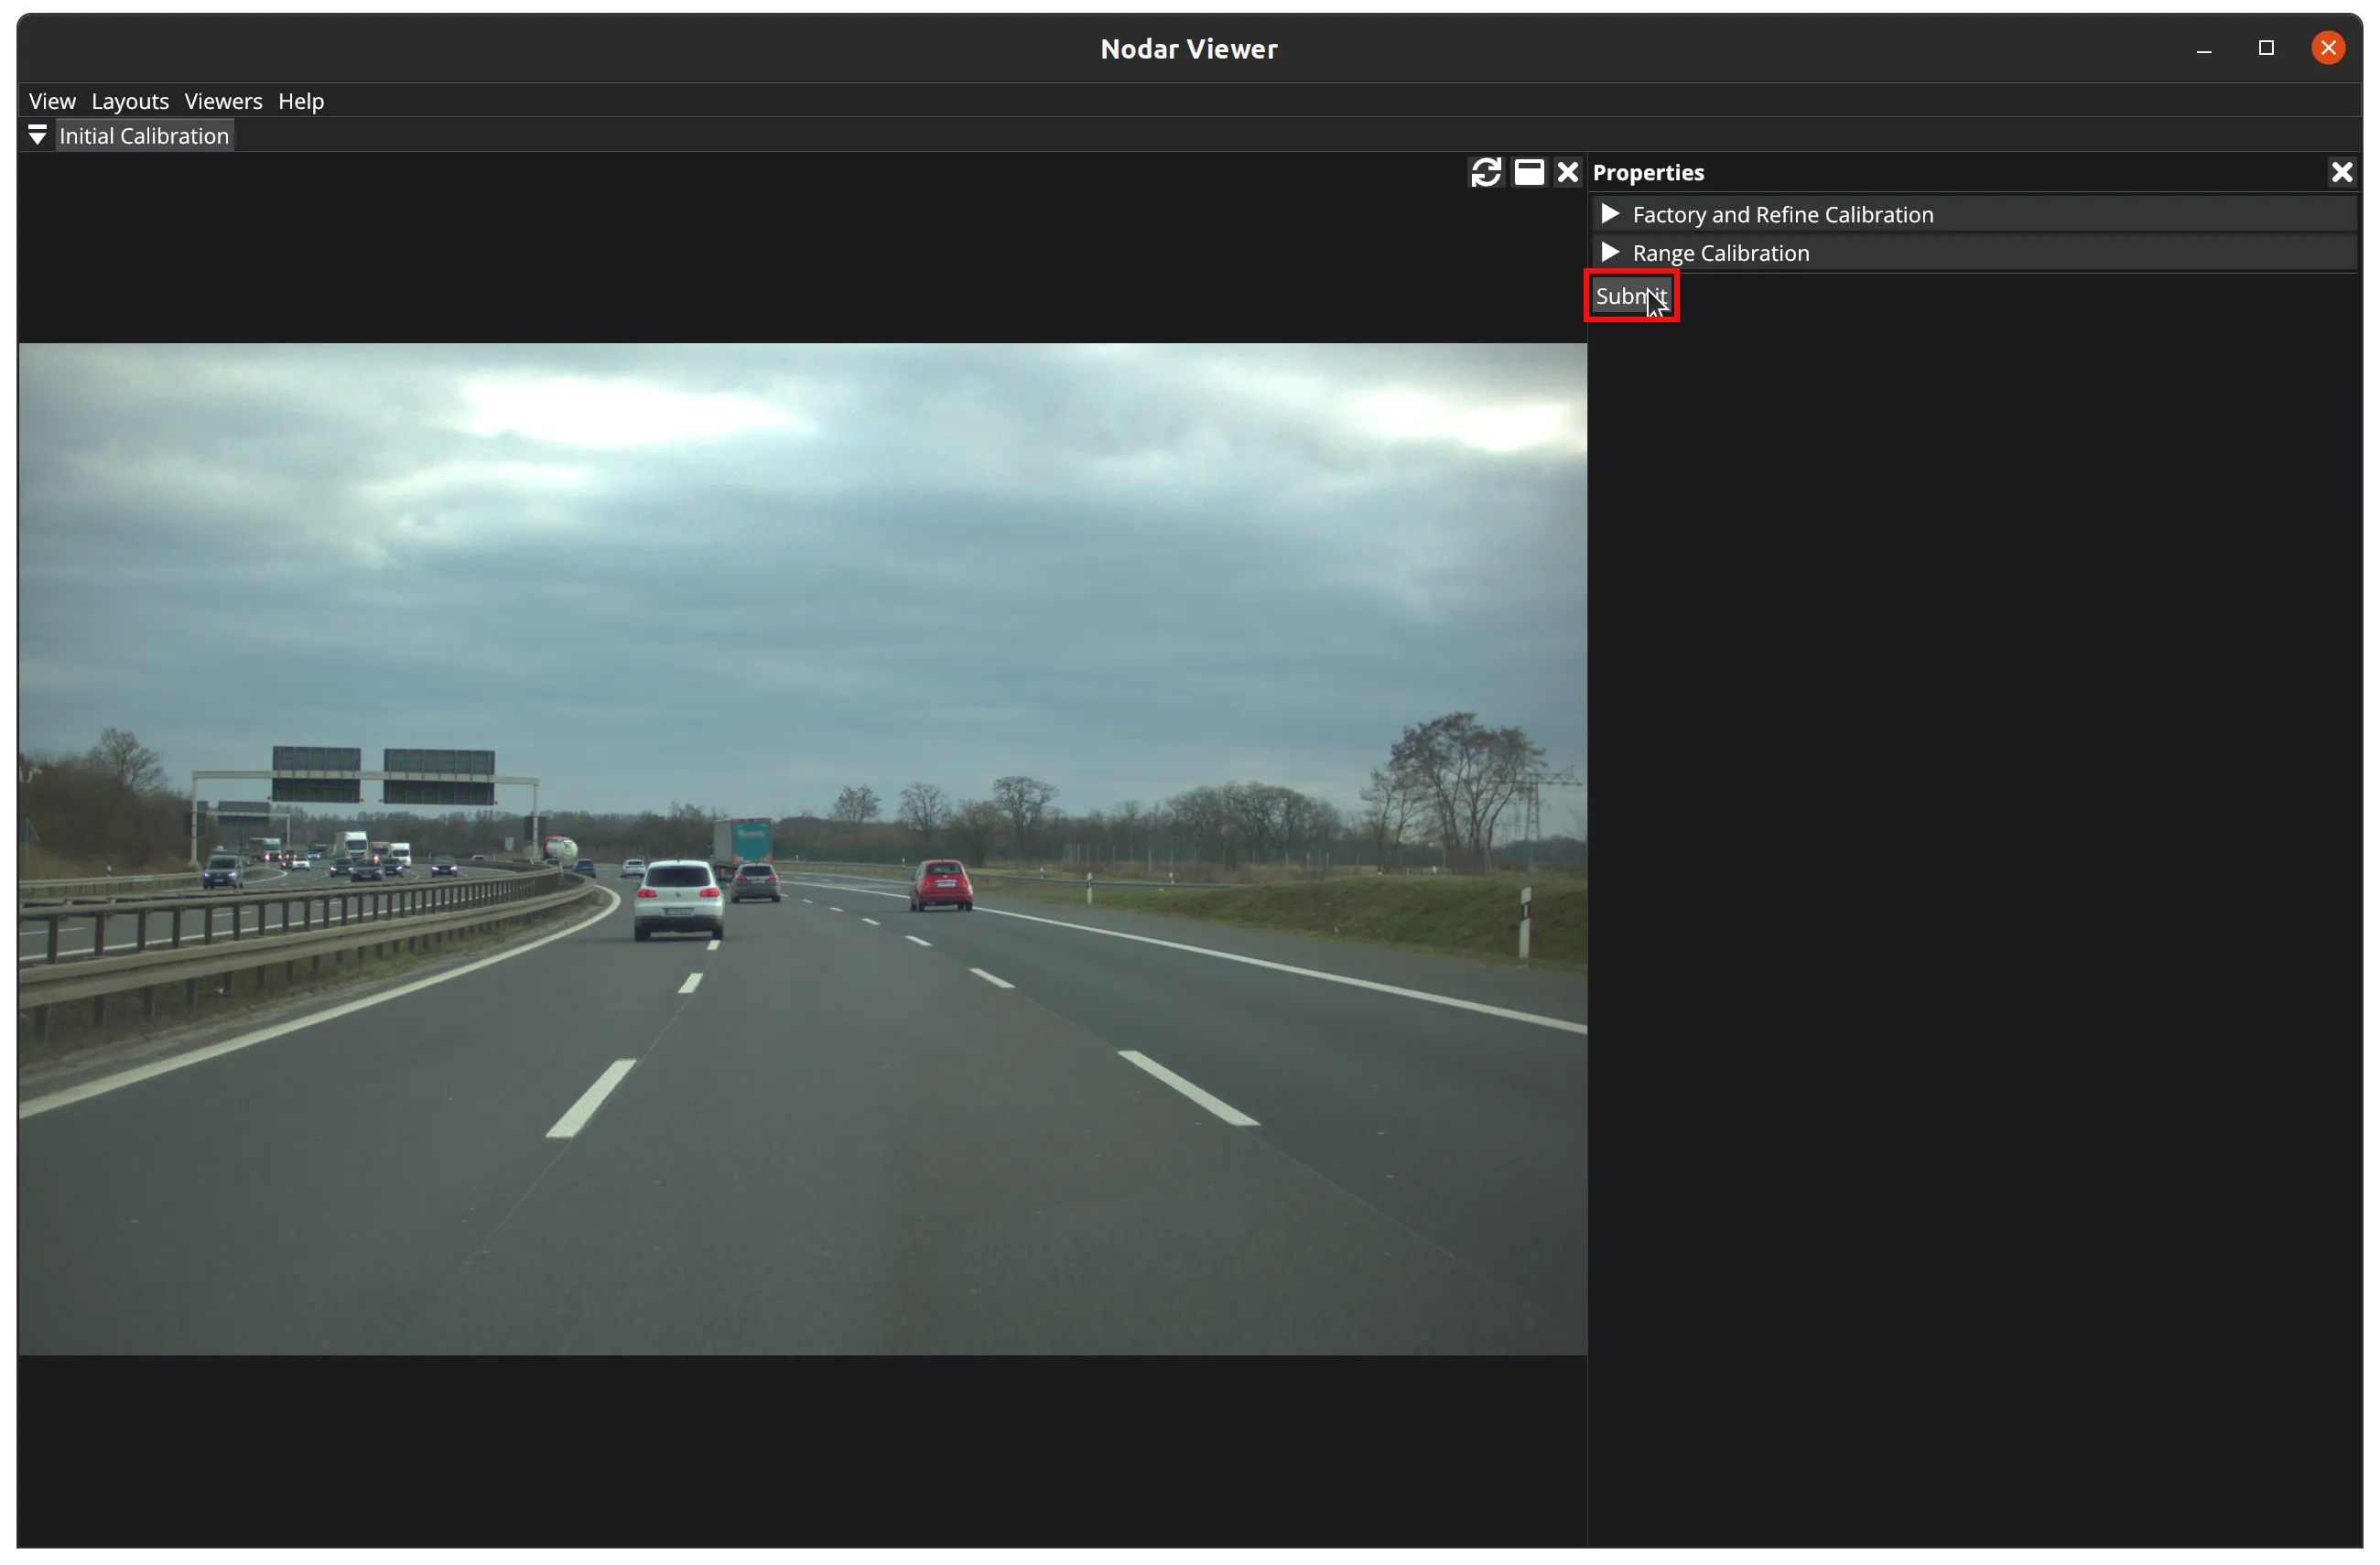
After enabling your desired calibration types, press the Submit button to initiate calibration on the Hammerhead system. During calibration, processing will pause and the viewer will stop receiving new data.
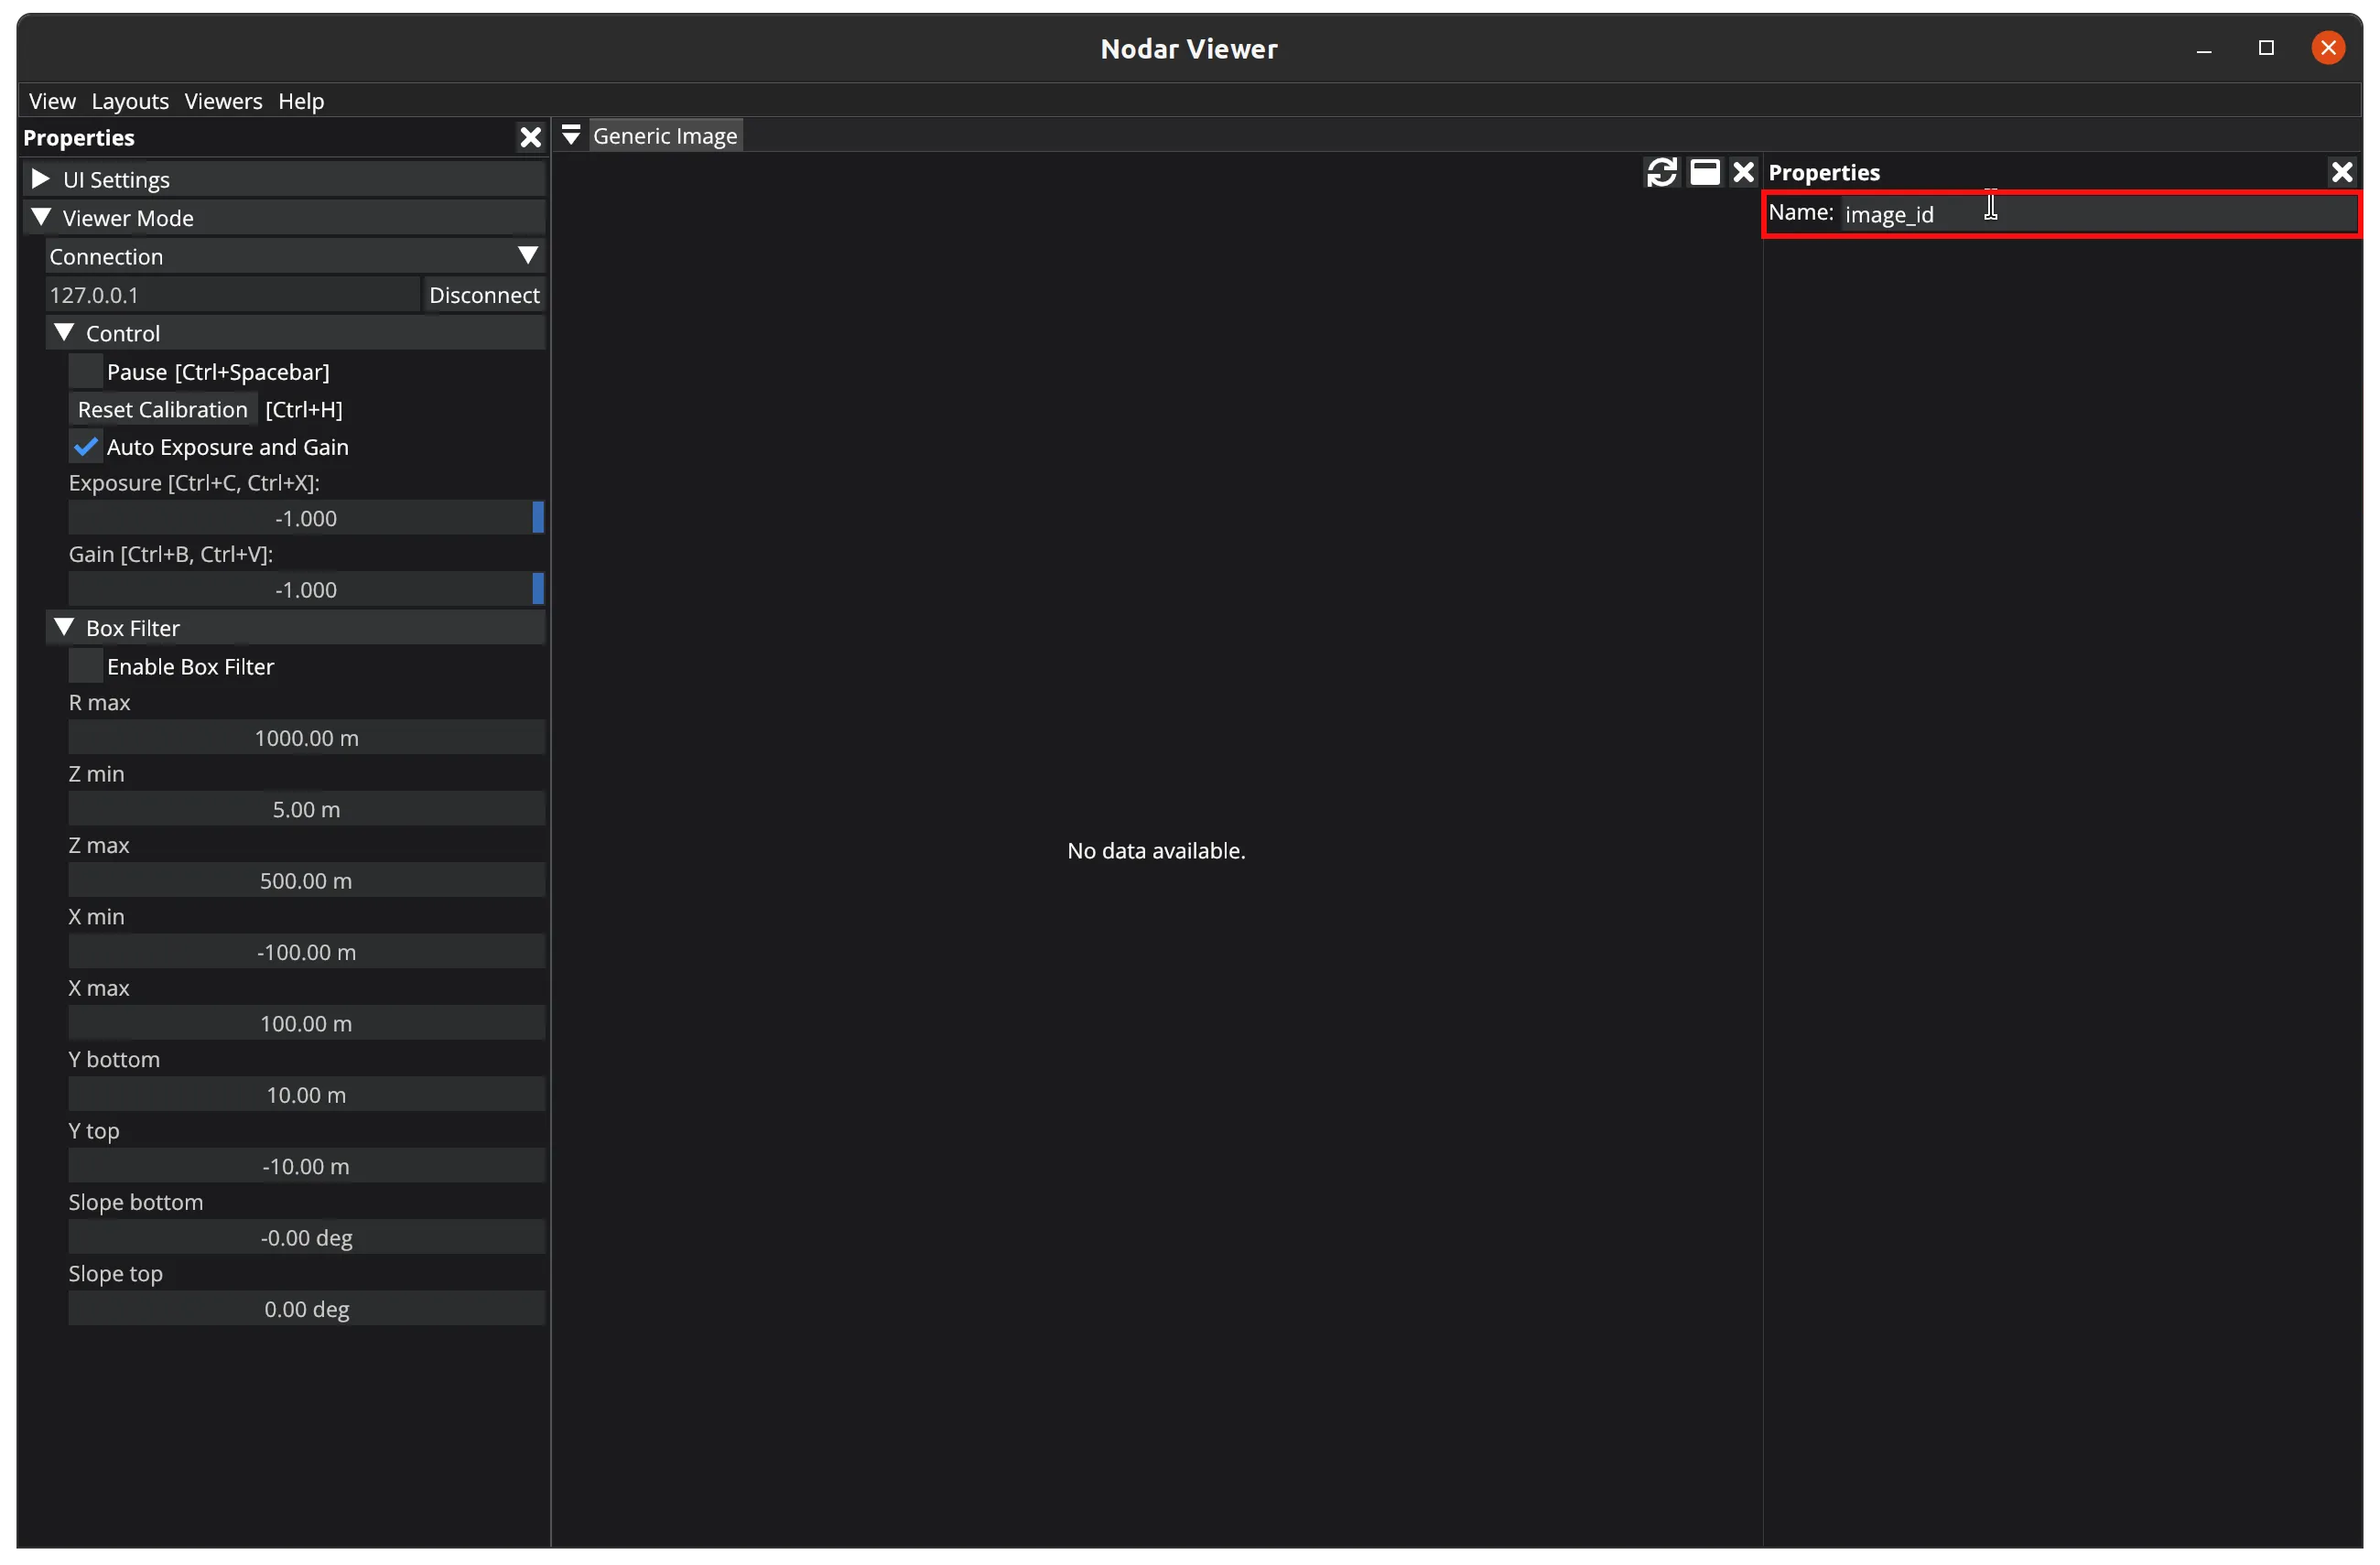
Generic Image
Some images don't fit into any of the listed categories. These may be images that Hammerhead receives from an external application. In such cases, Hammerhead publishes these images under specific names. To display such an image, simply type its name in the Name field of the Generic Image viewer.
Data Recorder
The Data Recorder viewer lets you save streamed data to your local hard disk. To use it, select a destination folder, choose which data you want to save, and press the Start button.
To record a generic image, enable Generic Images recording by selecting its checkbox, then enter the image name in the input field and click the Add button. You can add multiple images using this method. To remove a generic image, select it from the list and click the Remove button.
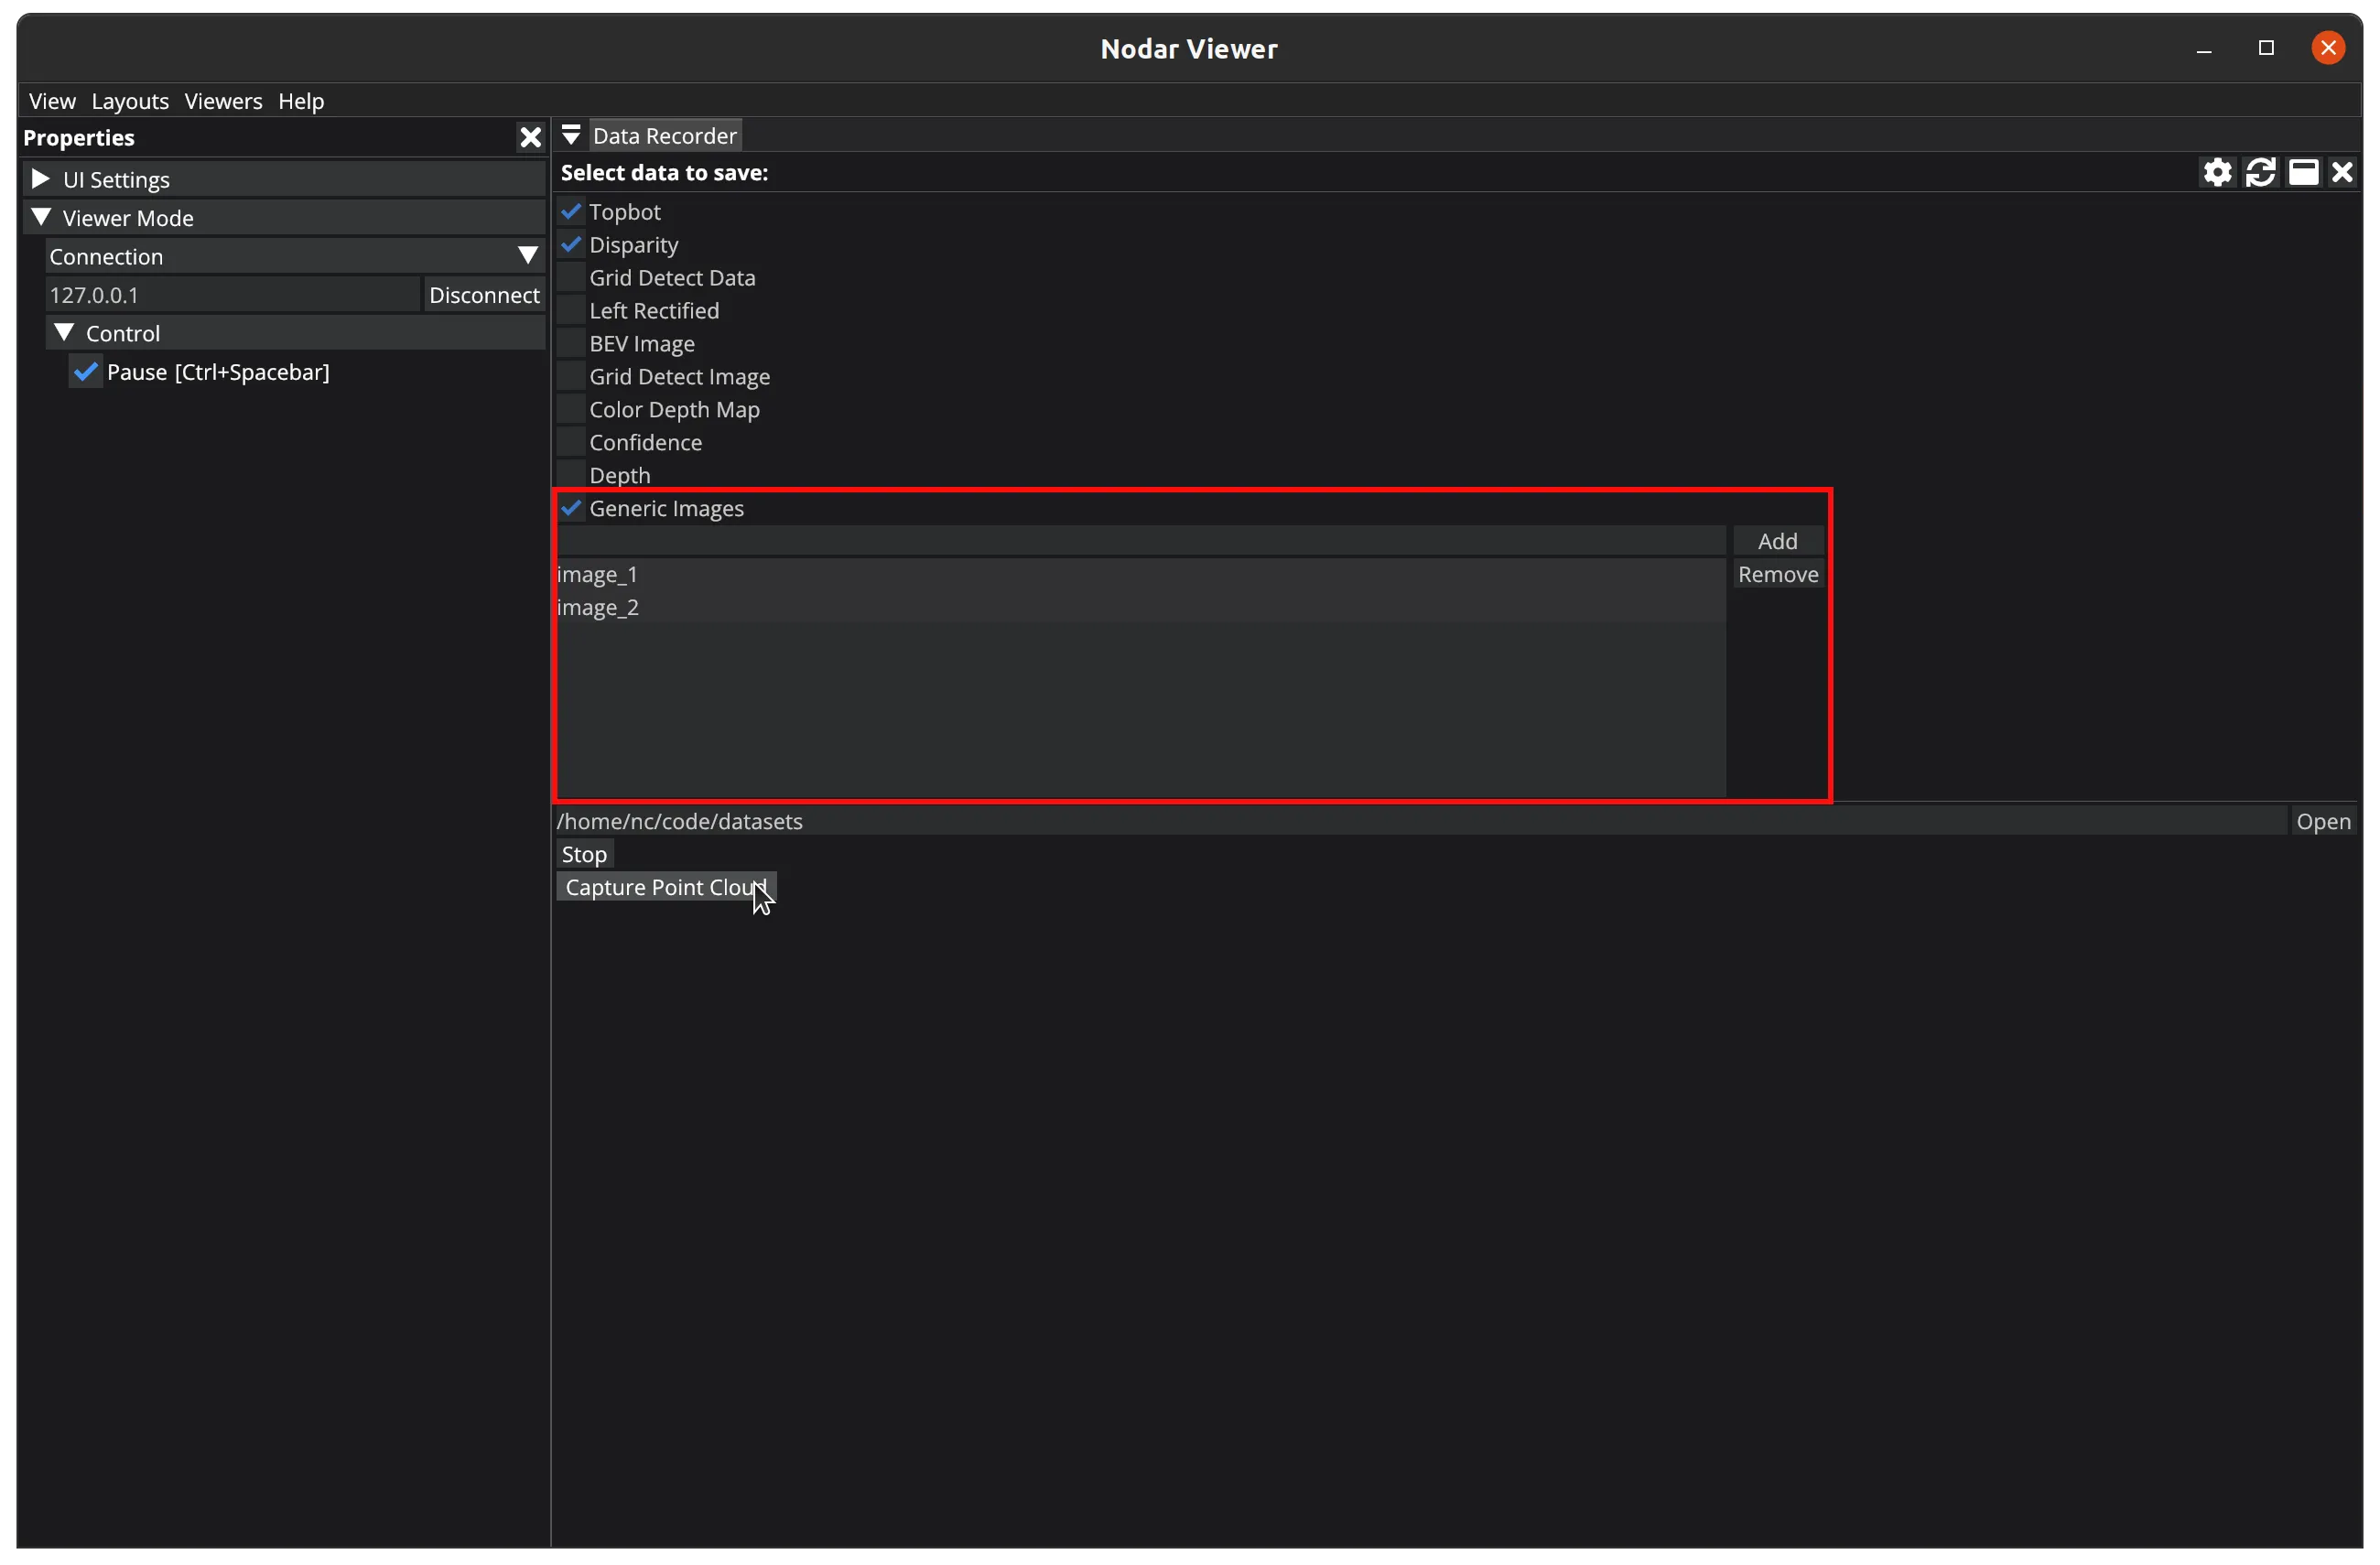
Keep in mind that saving is a resource-intensive operation — extensive use may degrade application performance. Since high-quality camera images require significant storage space, monitor your available disk space. To stop recording, press the Stop button.