Low-light City
Summary
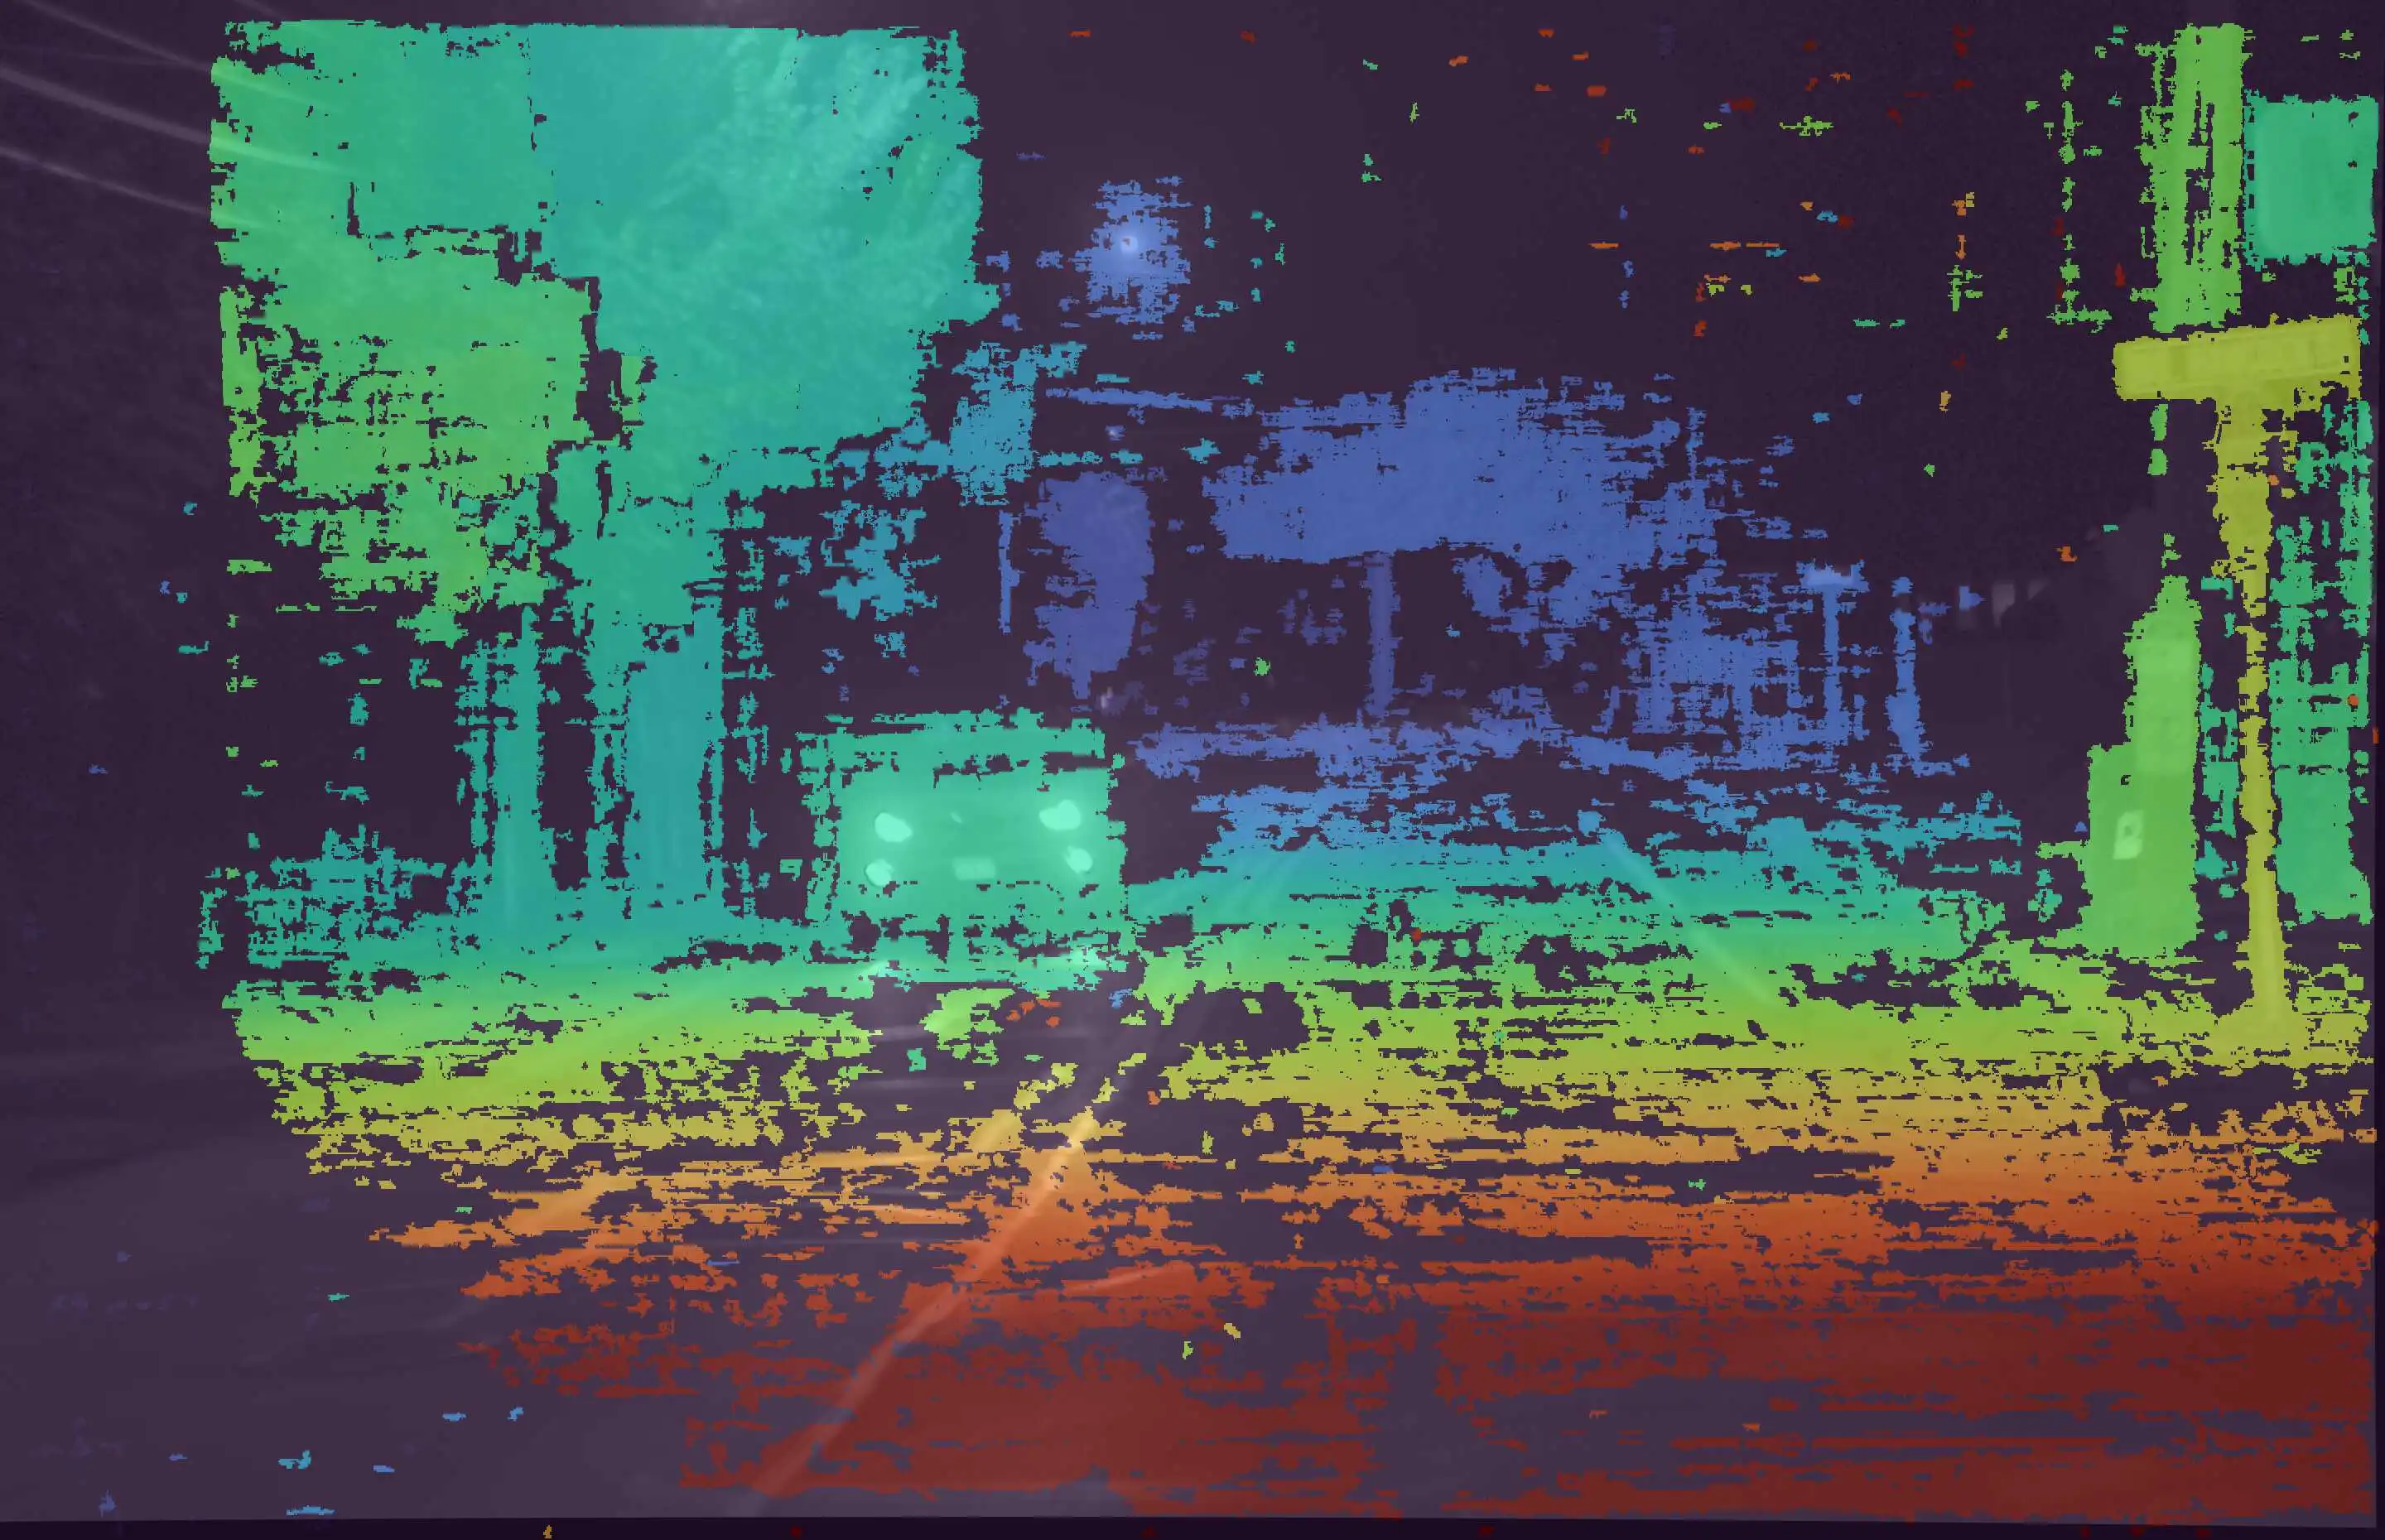
The data is recorded at night, with few street lights illuminating the scene. Our setup was mounted on top of a car which was driving through the streets of a city, collecting time-synchronized data at 2.2 FPS. It demonstrates a challenging condition due to significantly lower illuminance or lux. This require the cameras to capture images at enhanced exposures, while balancing the blur it introduces due to motion. The depth-maps reveal that our stereo-matching algorithm can identify features even in seemingly dark surfaces like the road, tree trunks, and curb.
Hammerhead and GridDetect
Dataset Download (.zip) (10.0 GB)
Point Cloud Download (.zip) (1.9 GB)
GroundTruth
GroundTruth Download (.zip) (11.0 GB)
Camera Specifications
| Horizontal Field of View | 30 degrees |
|---|---|
| Baseline | 1.17 meters |
| Resolution | 5.4 MP |
| Bit depth | 16 bit |
| Frame rate | 2.2 FPS |
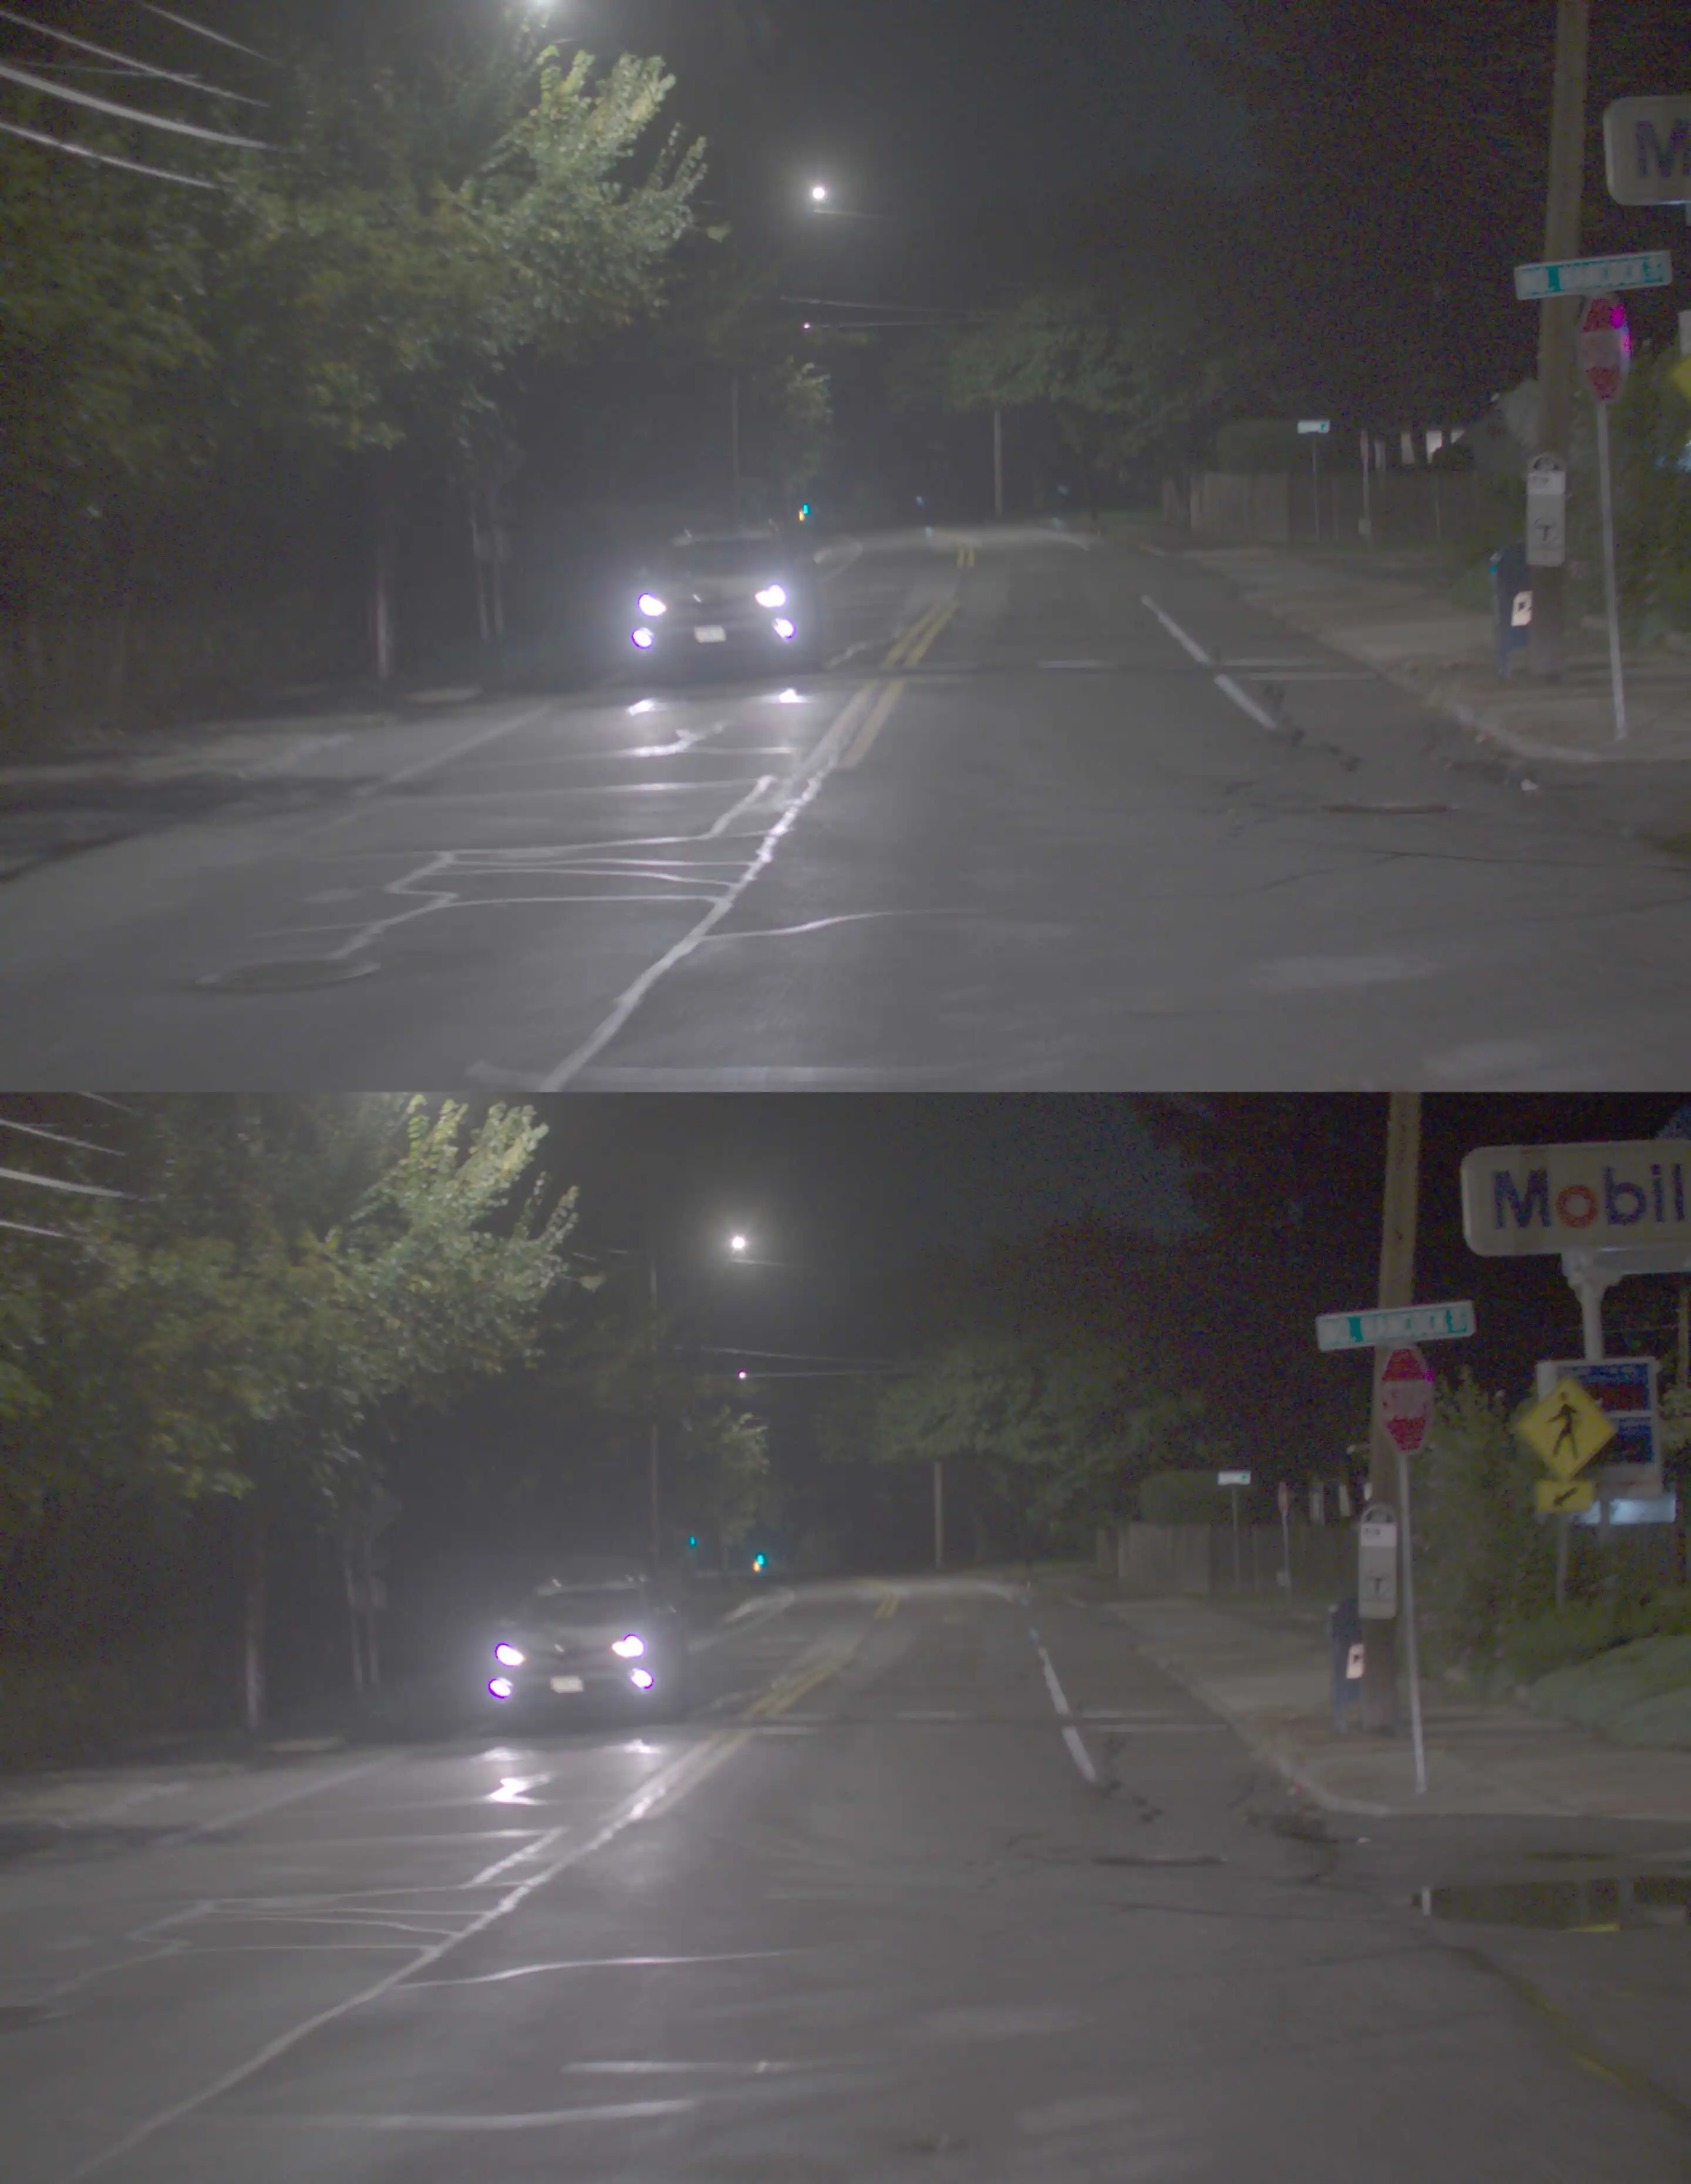
Topbot Images
These are vertically concatenated raw images from the left and right camera as shown below:
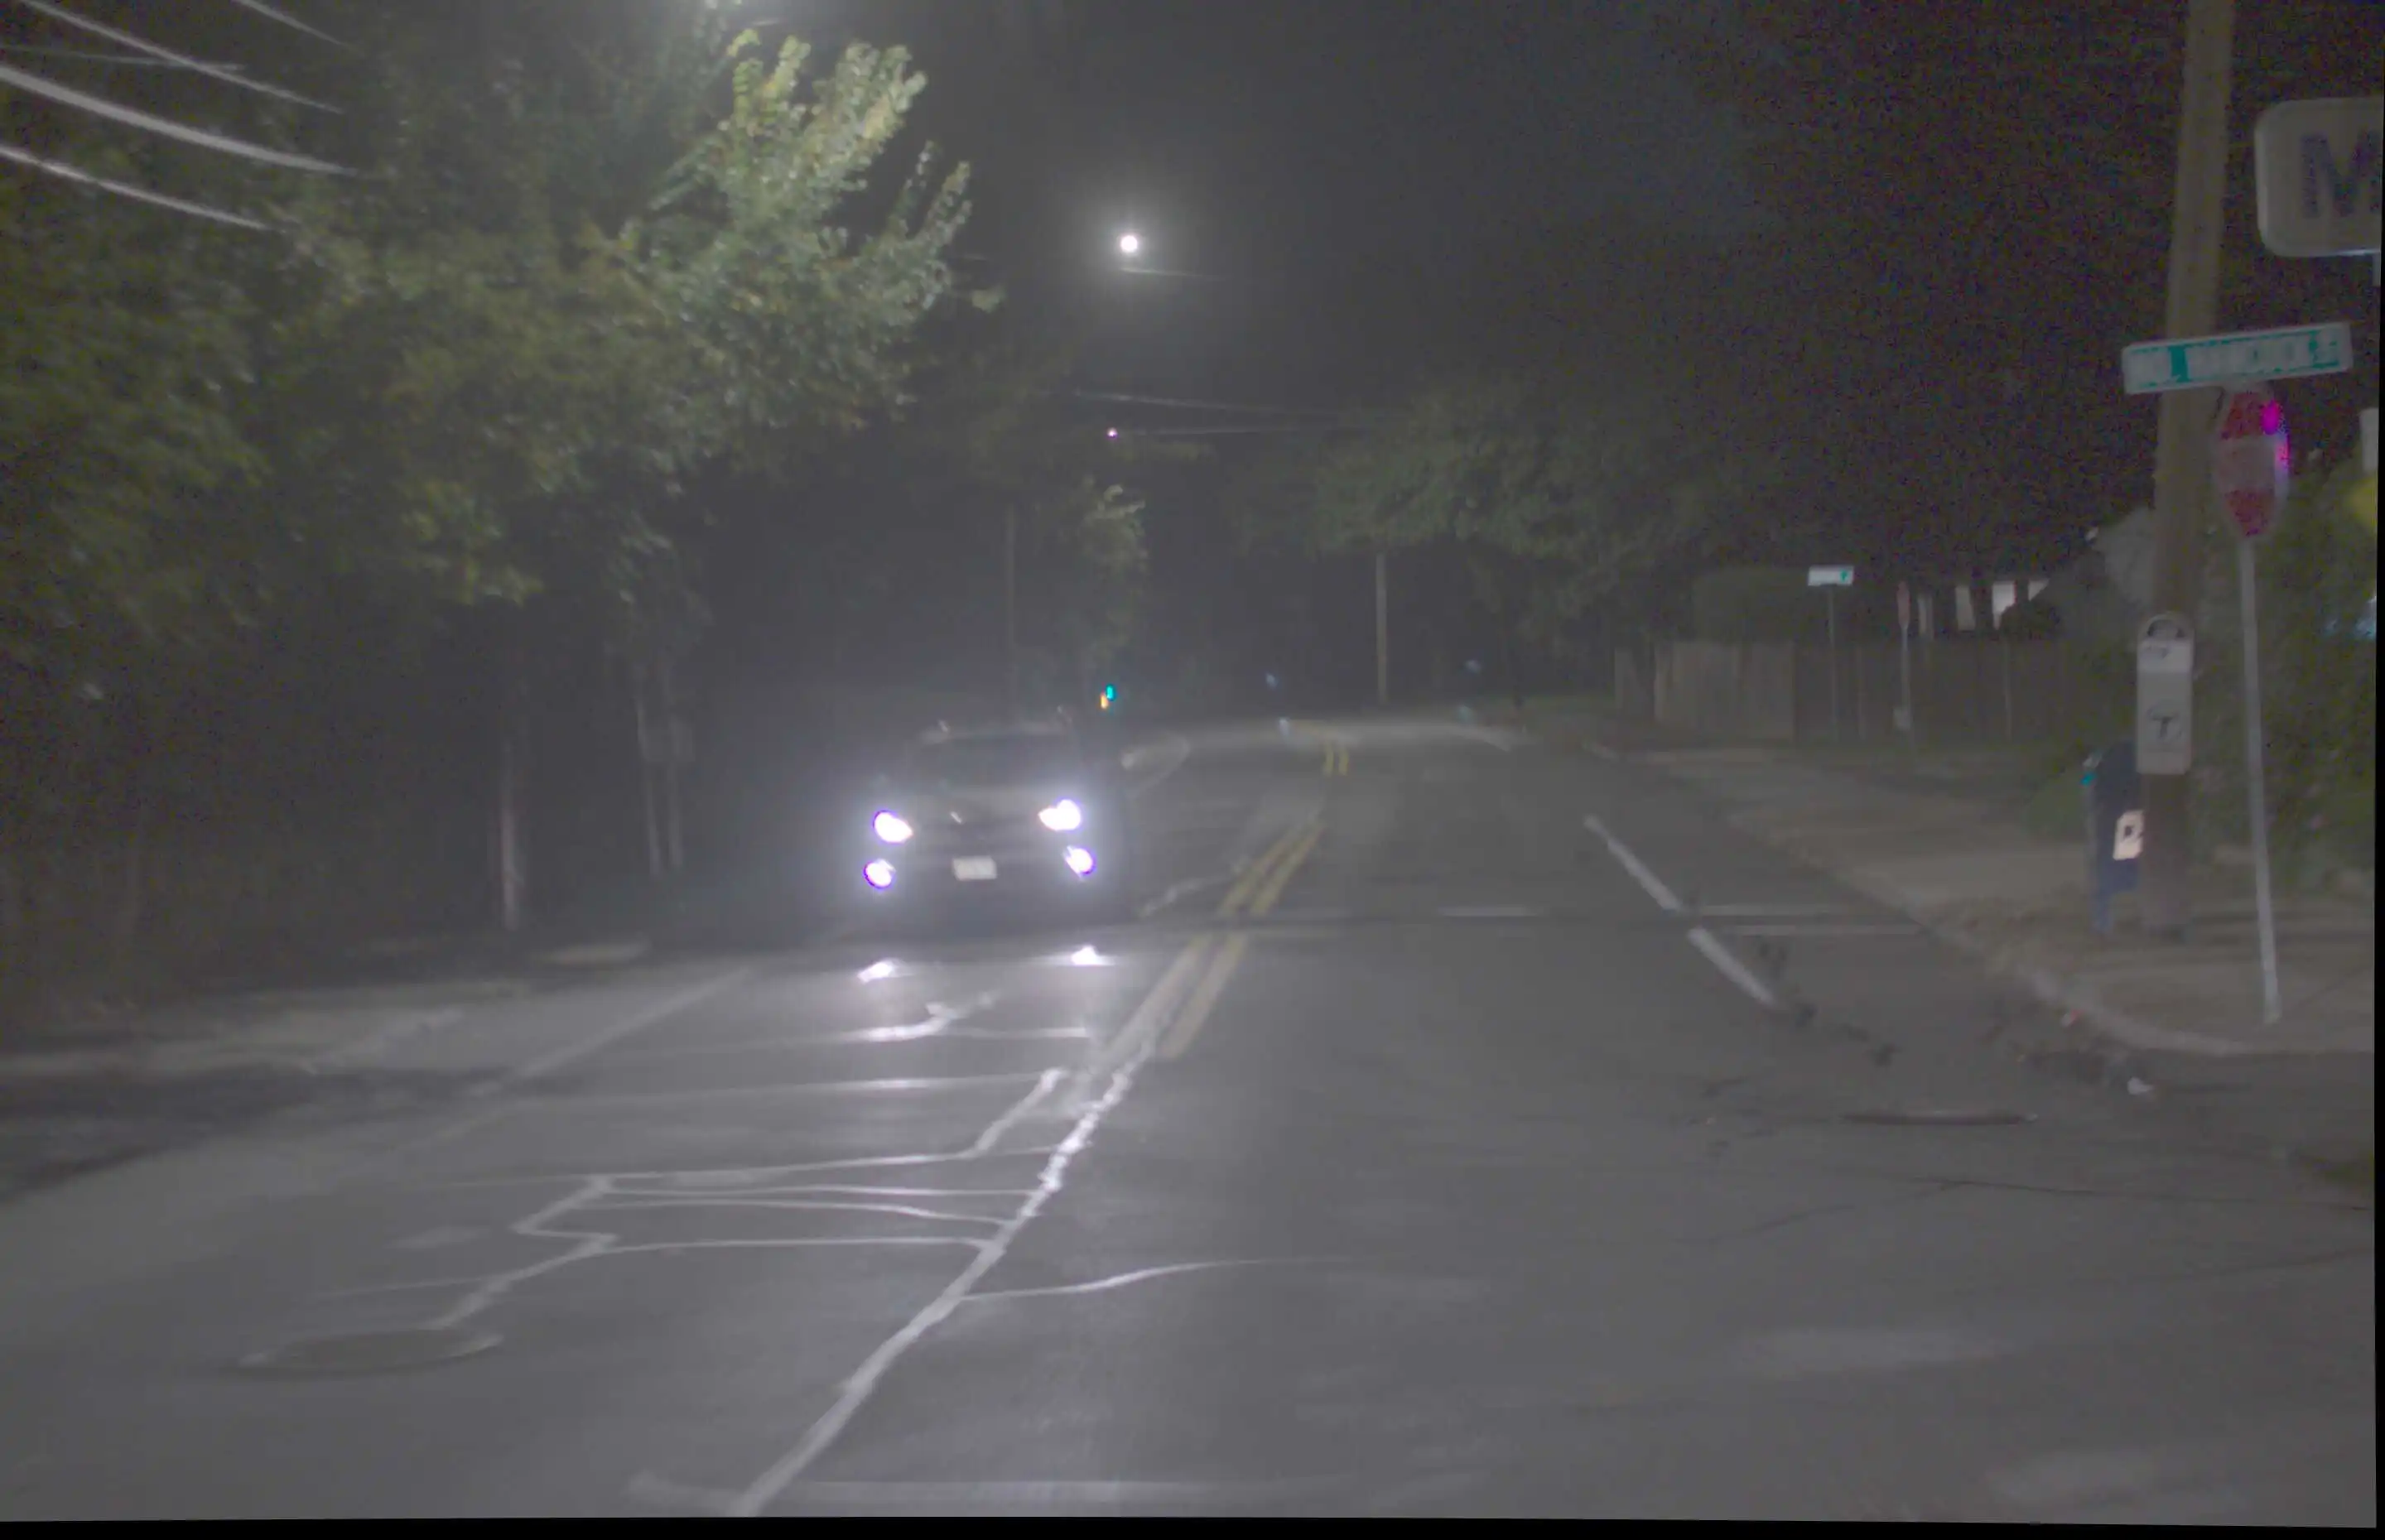
Left-rectified Images
The left-rectified image shows the image from the left camera after rectification, as shown below:
Hammerhead and GridDetect Performance
Depth Map
The depth map is an image, where each pixel corresponds its depth information in meters. It can be better visualized in the colored depth maps, with blended RGB channel shown below:
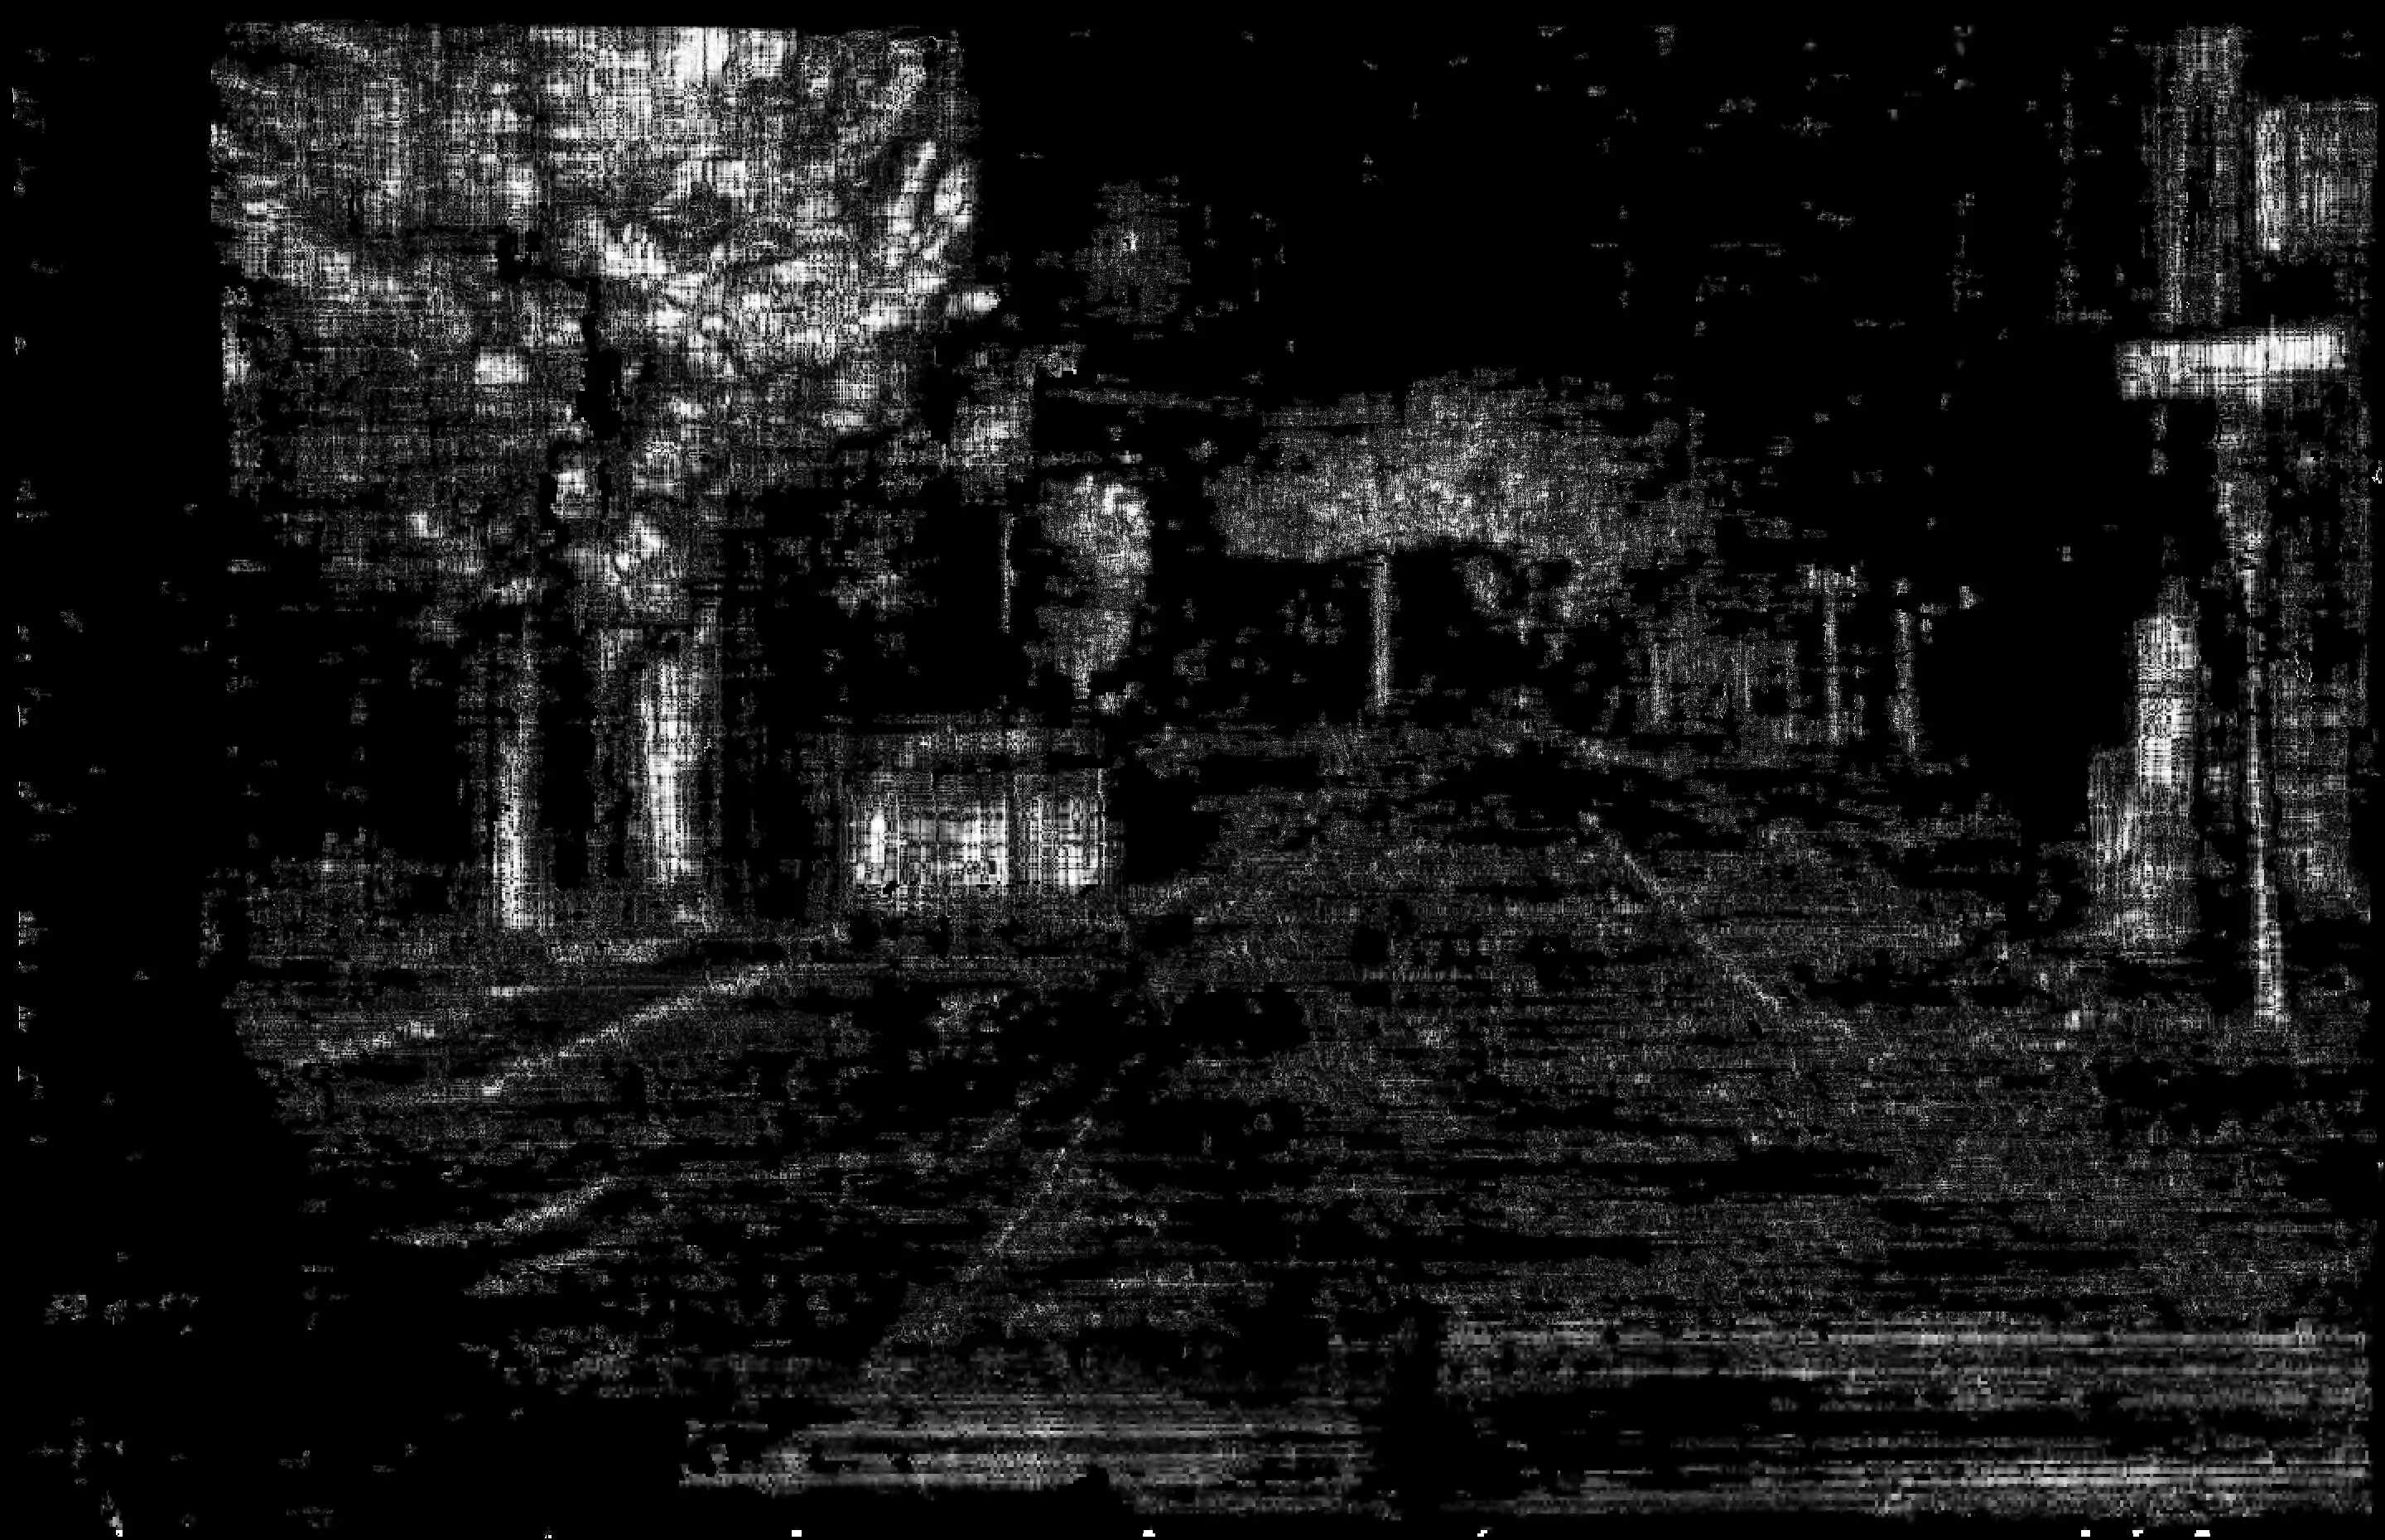
Confidence Map
The confidence map stores the confidence in the depth information produced by our stereo-matching algorithm, as shown below:
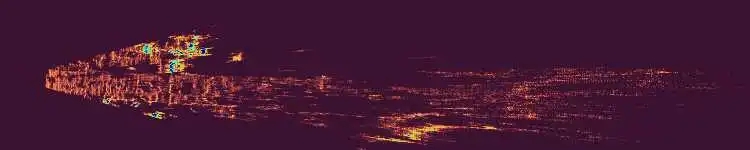
BEV Visualization
The Bird's Eye View (BEV) is a discrete representation of the point cloud looking from a top view. Each grid cell is 0.2m-by-0.2m, and the color of a grid cell in BEV encodes the density of points it accommodates. Consequently, objects on the road appear brighter in BEV. The forward direction (z-axis) is encoded along the horizontal dimension and captures up to a range of 150 m, while the lateral direction (x-axis) is encoded in the vertical dimension of BEV.
Object Detection
Our detection module compresses the dense pointcloud data into succinct bounding boxes around objects, in BEV. It also accounts for temporal correlations, enabling it to assess relative velocity of the objects in the X-Z plane. The output is a .csv file and each row stores the locations of the 3 consecutive corners of the bounding box (x1, z1, …) in meters, and relative velocity along x and z directions (vx, vz) in m/s. This is followed by the coordinates of the cells that are occupied by the object in BEV. The bounding boxes can be visualized through our viewer by checking the box "Display Boxes" in the "Point Cloud" window.