Highway Driving
Summary
The data constitutes two stereo image pairs collected from cameras mounted on a vehicle while driving on a highway. Nodar’s proprietary calibration technology is used for calibrating the cameras on a frame-to-frame basis to account for any temporal shift introduced during operation, and the stereo-depth is estimated. The information-rich pointclouds are further processed by Nodar’s proprietary detection and tracking technology to identify object position and velocity in the Bird’s Eye View (BEV).
Traveling south on Bundesautobahn 9 near exit 48 to Schnaittach. Google Map link here.
Hammerhead and GridDetect
Dataset Download (.zip) (17.1 GB)
Point Cloud Download (.zip) (7.9 GB)
GroundTruth
GroundTruth Download (.zip) (11.4 GB)
GroundTruth Minimal Download (.zip) (273 MB) — 10 frames only
Camera Specifications
| Horizontal Field of View | 30 degrees |
|---|---|
| Baseline | 1.14 meters |
| Resolution | 5.4 MP |
| Bit depth | 8 bit |
| Frame rate | 10 FPS |
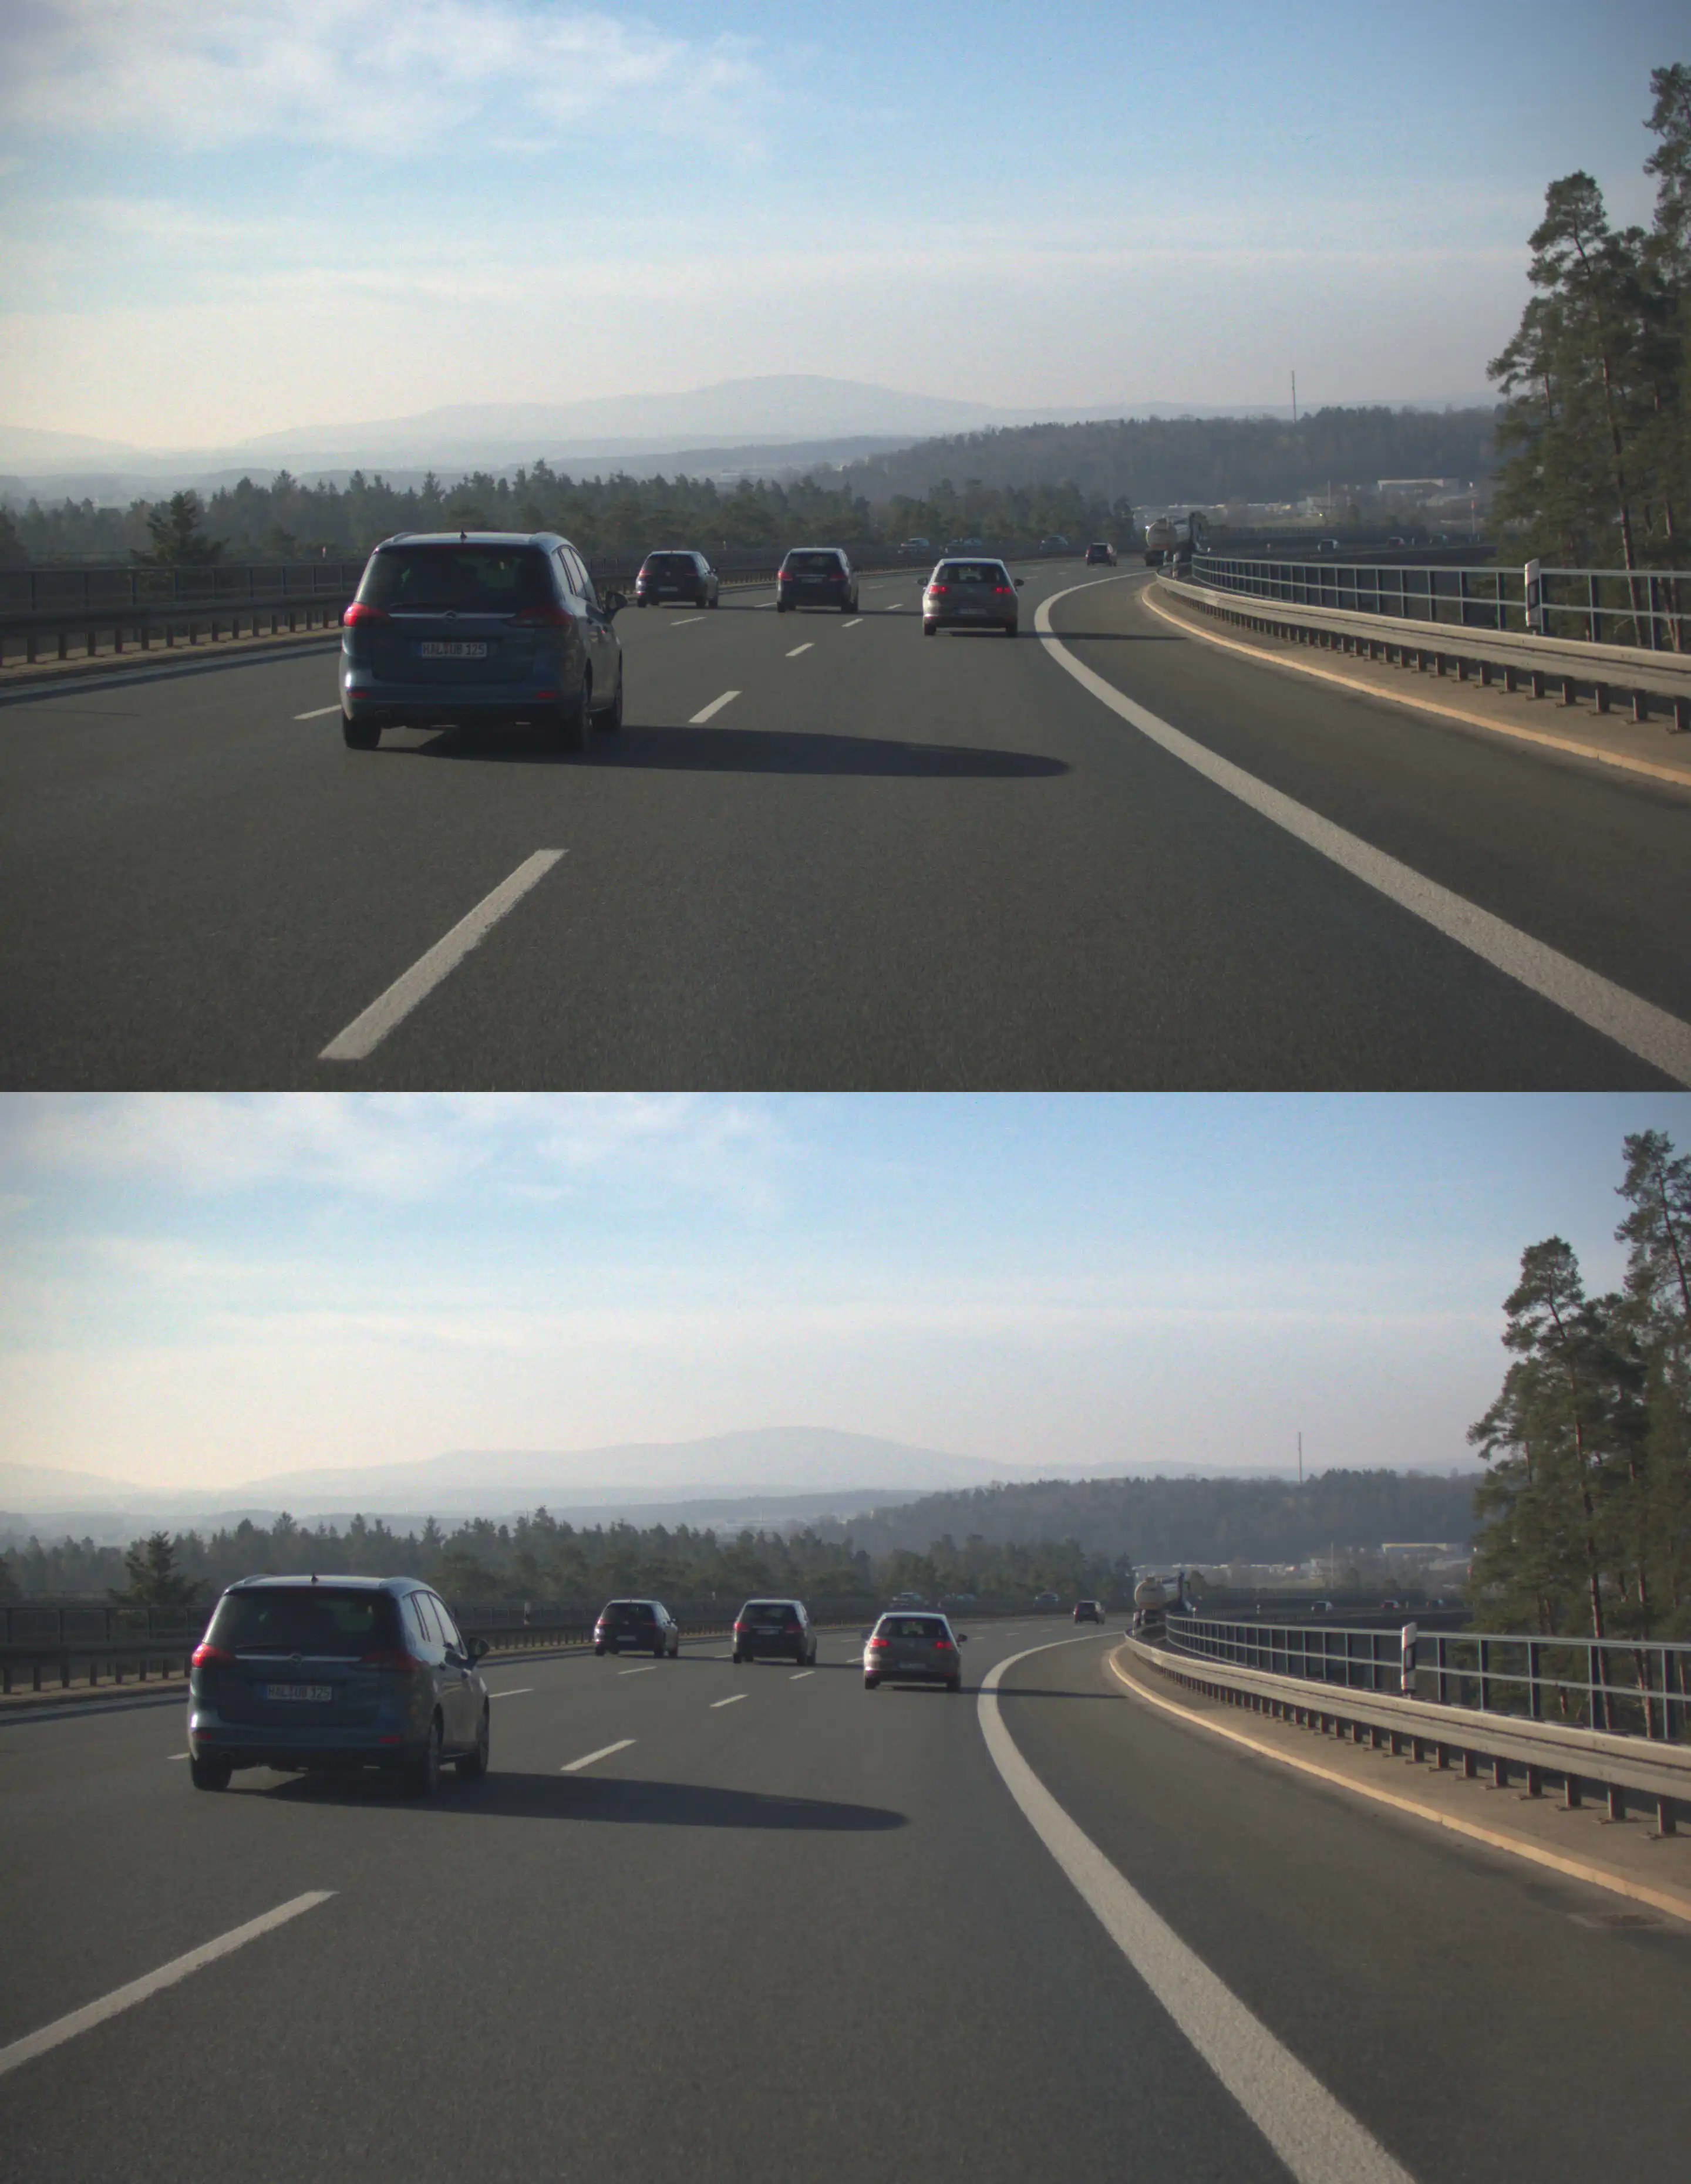
Topbot Images
A top-bot image is created by vertically concatenating the raw left and right camera image, as shown below:
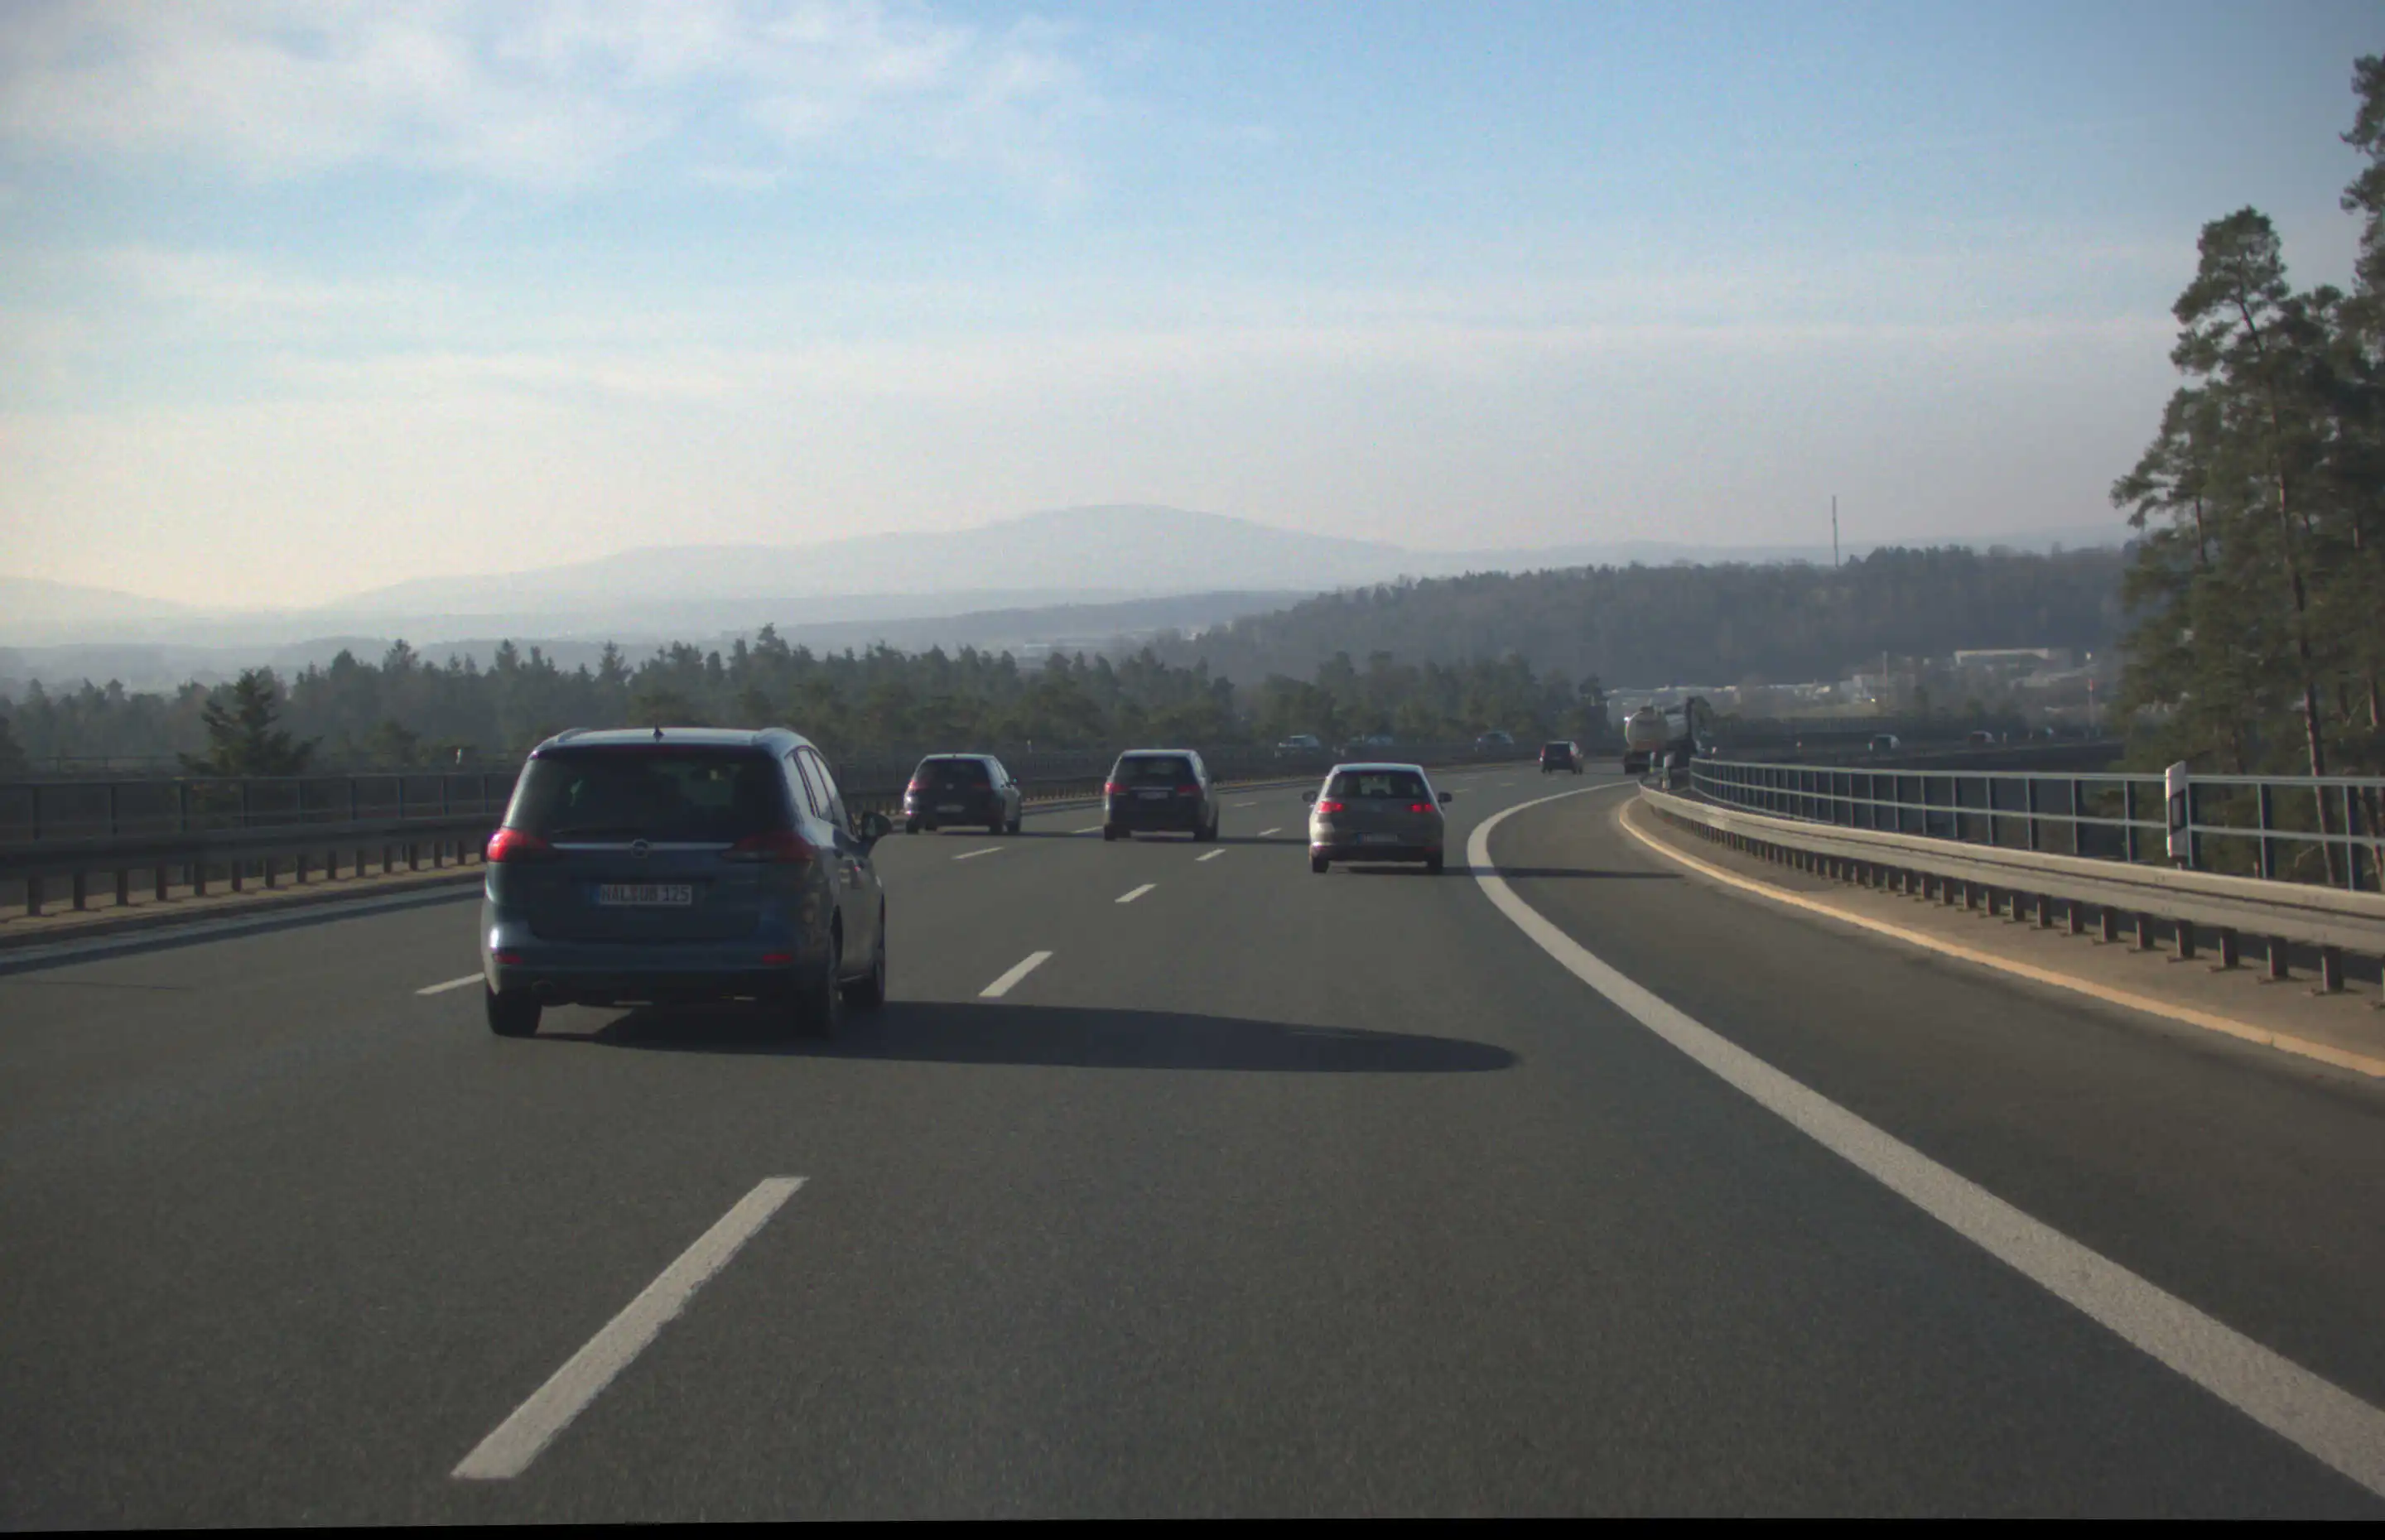
Left-rectified Images
The left-rectified image shows the image from the left camera after rectification, as shown below:
Hammerhead and GridDetect Performance
Depth Map
The depth map is an image, where each pixel corresponds its depth information in meters. It can be better visualized in the colored depth maps, with blended RGB channel shown below:
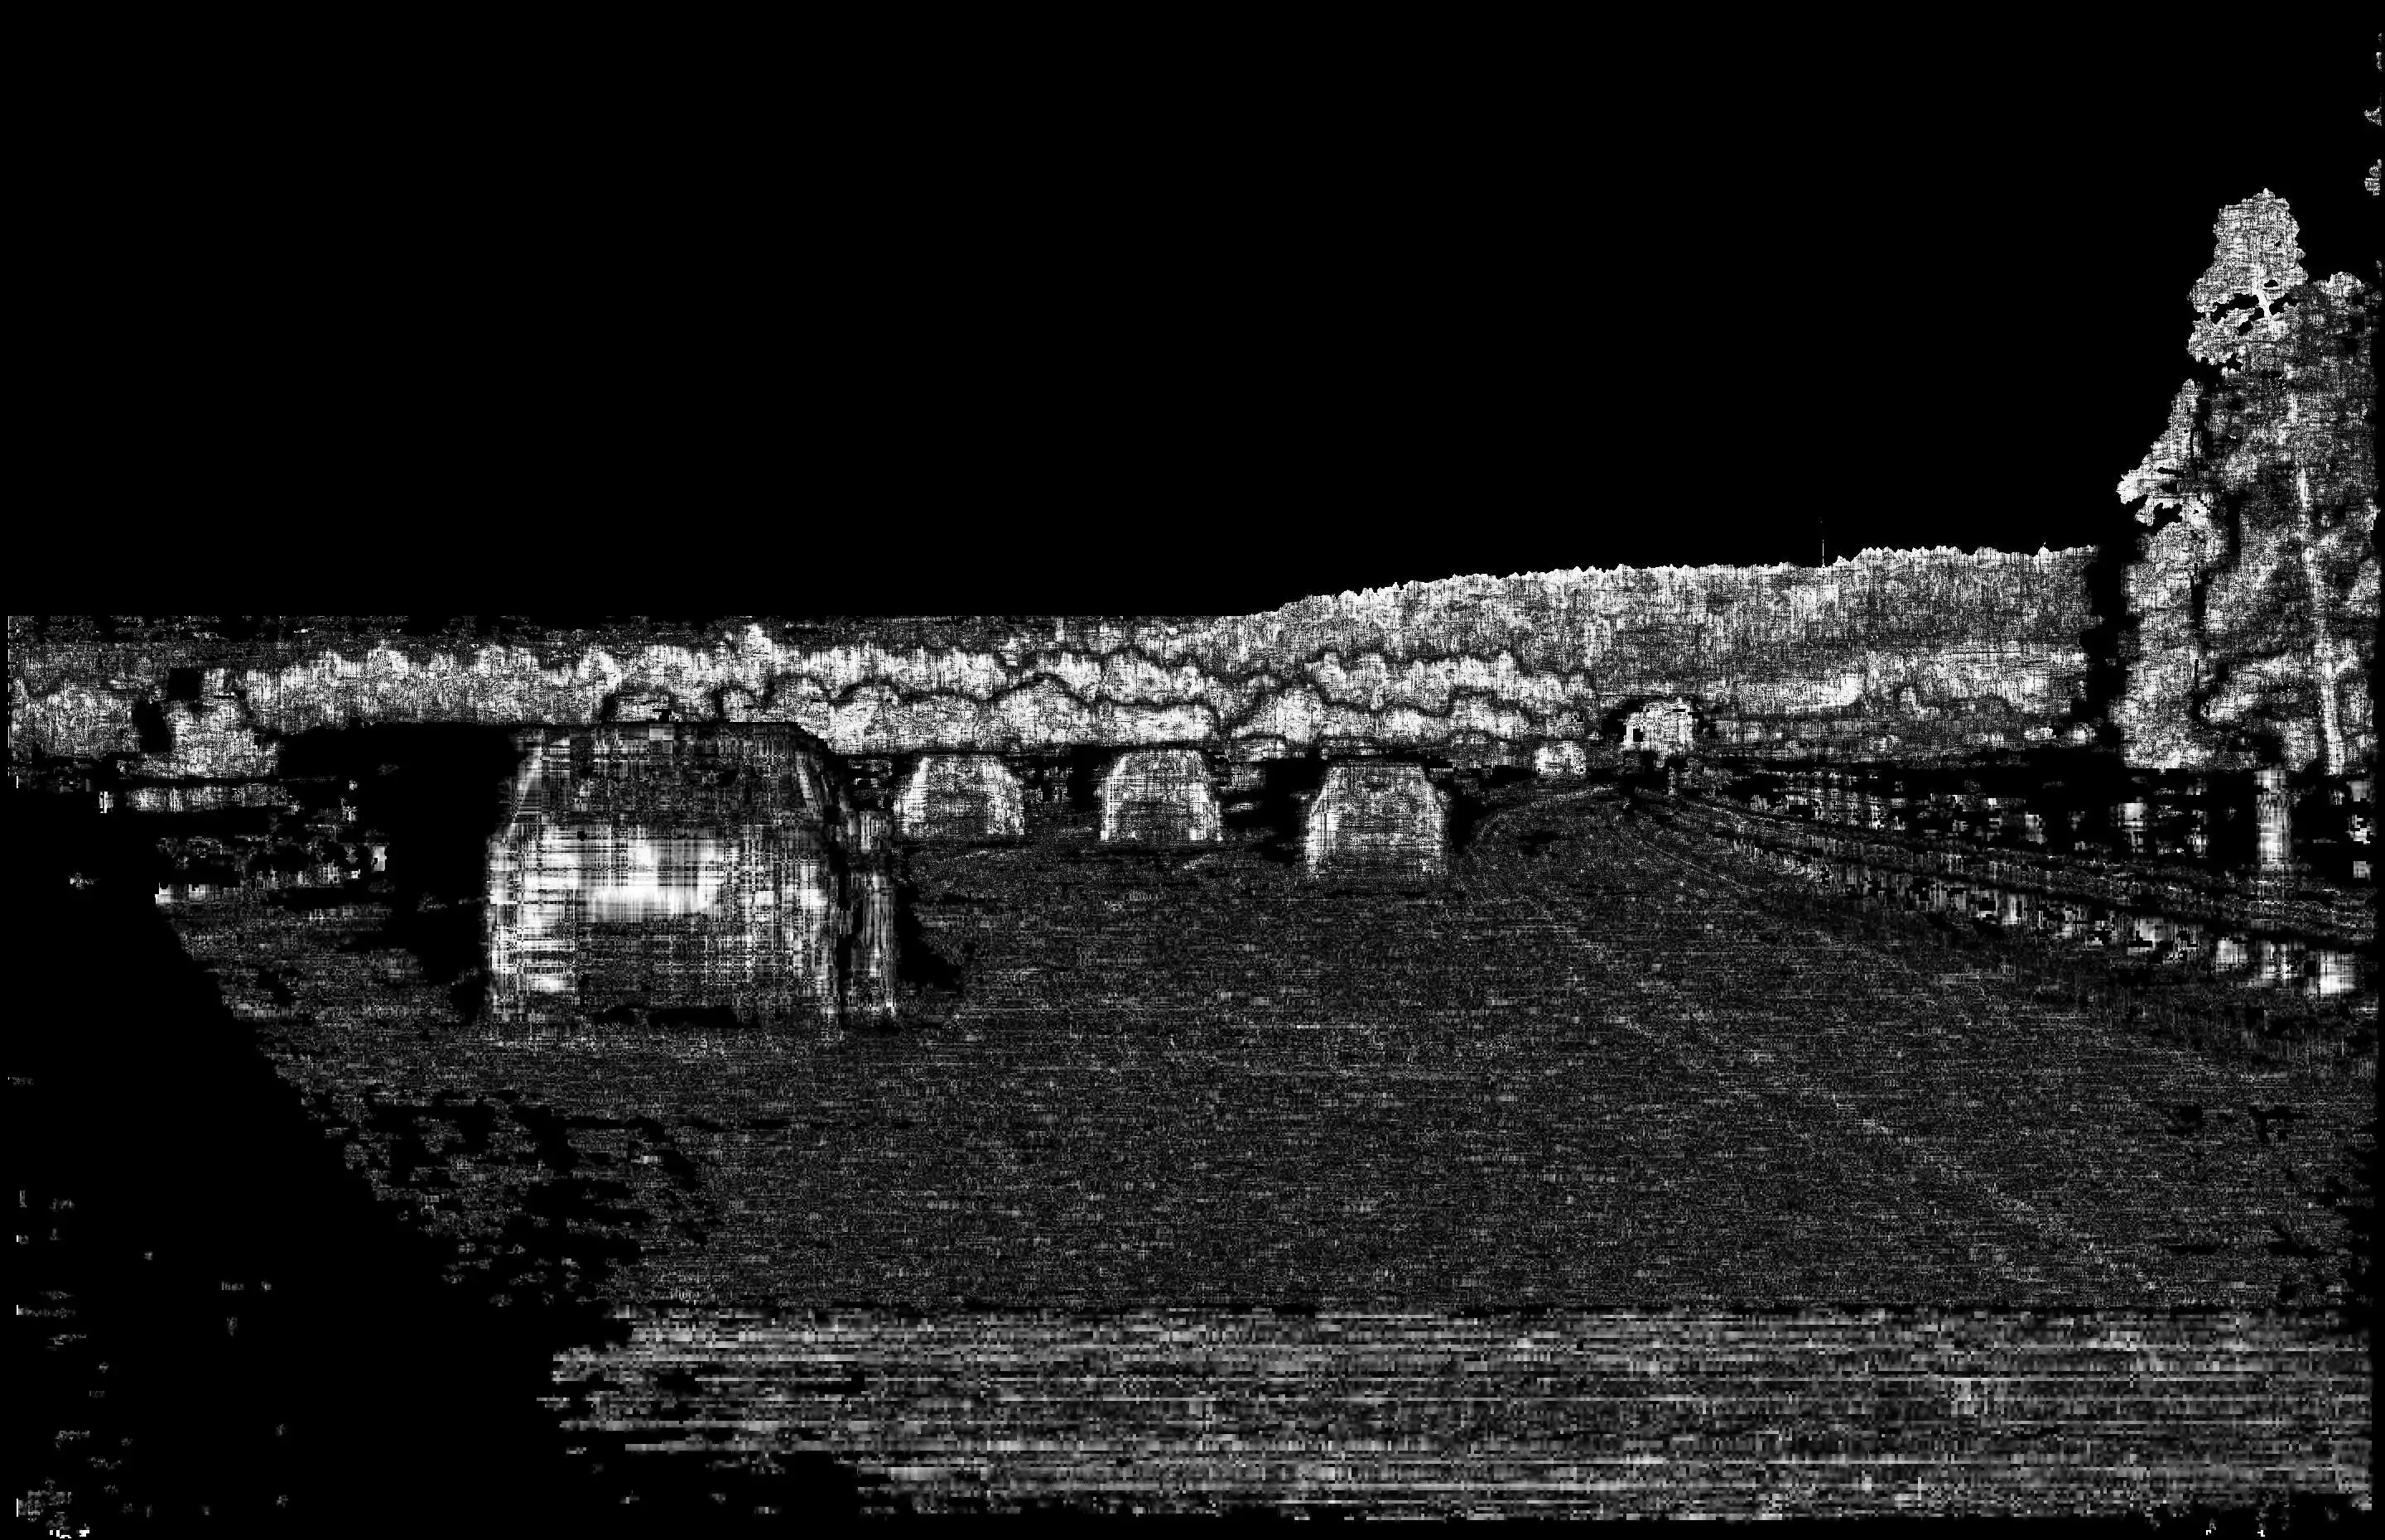
Confidence Map
The confidence map stores the confidence in the depth information produced by our stereo-matching algorithm, as shown below:
Pointcloud
The pointcloud is a dense representation of the information coming from the depth map and the RGB image, at each frame, depicting the surrounding world with 6-channels:
NODAR viewer allows us to visualize these pointclouds and supports different custom settings for an optimal viewing experience. The missing regions in the point cloud correspond to areas that are either outside the overlapping field of view of the two cameras or are occluded for one of the cameras.
BEV Visualization
The Bird’s Eye View (BEV) is a discrete representation of the point cloud looking from a top view. Each grid cell is 0.2m-by-0.2m, and the color of a grid cell in BEV encodes the density of points it accommodates. Consequently, objects on the road appear brighter in BEV. The forward direction (z-axis) is encoded along the horizontal dimension and captures up to a range of 200 m, while the lateral direction (x-axis) is encoded in the vertical dimension of BEV and captures +/- 20 m from the ego vehicle.
Object Detection
Our detection module compresses the dense pointcloud data into succinct bounding boxes around objects, in BEV. It also accounts for temporal correlations, enabling it to assess relative velocity of the objects in the X-Z plane. The output is a .csv file and each row stores the locations of the 3 consecutive corners of the bounding box (x1, z1, …) in meters, and relative velocity along x and z directions (vx, vz) in m/s. The bounding boxes can be visualized through our viewer by checking the box “Display Boxes” in the “Point Cloud” window.
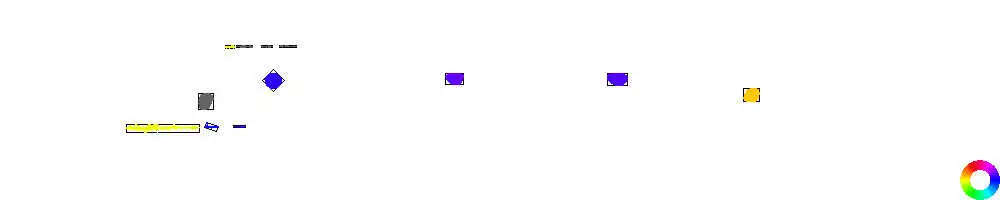
Dynamic Occupancy Map
The dynamic occupancy map visualizes the occupancy of each cell in BEV, along with relative velocity direction wrt the ego vehicle. The velocity direction can be inferred based on the color wheel, e.g. motion towards the ego vehicle is yellow, while motion away from it is depicted in blue color. Grey color denotes stationary targets wrt the ego vehicle.